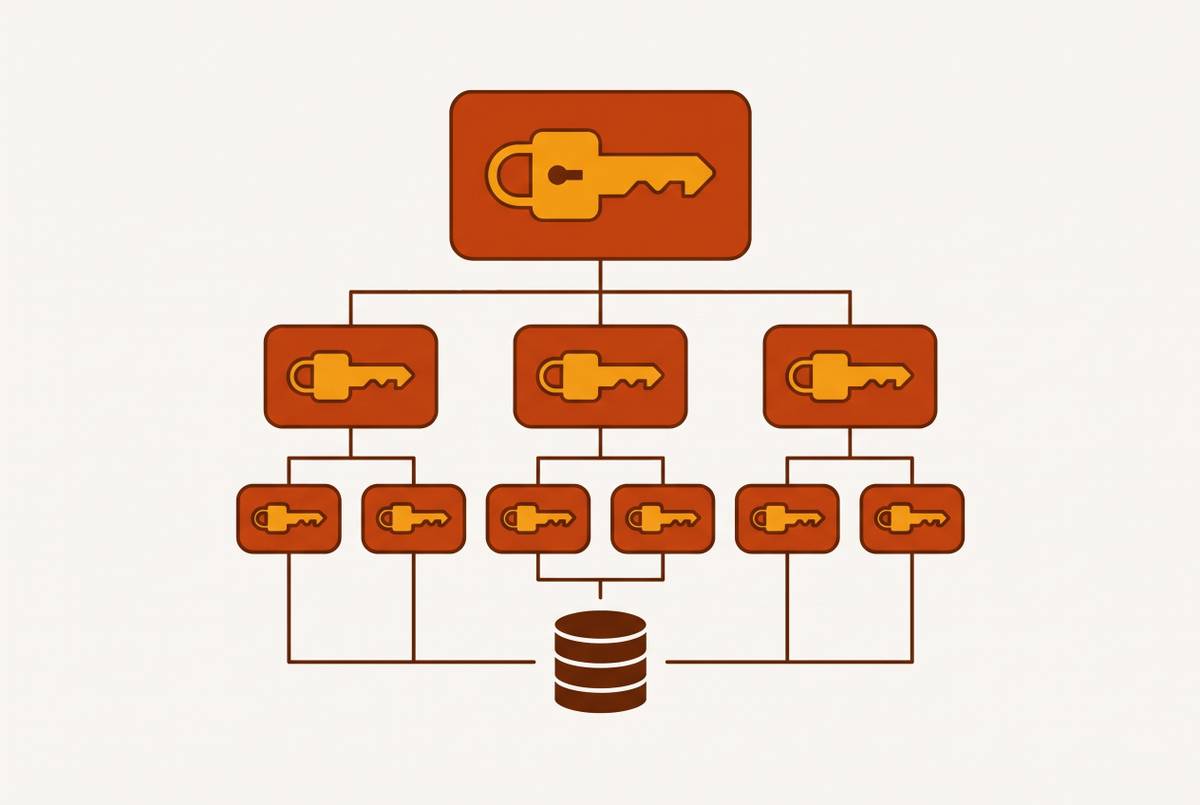
What Eighty People Actually Spend Engineering Hours on When There Is No Self-Serve Data Layer
Engineering becomes the bottleneck when teams lack governed self-serve data access.
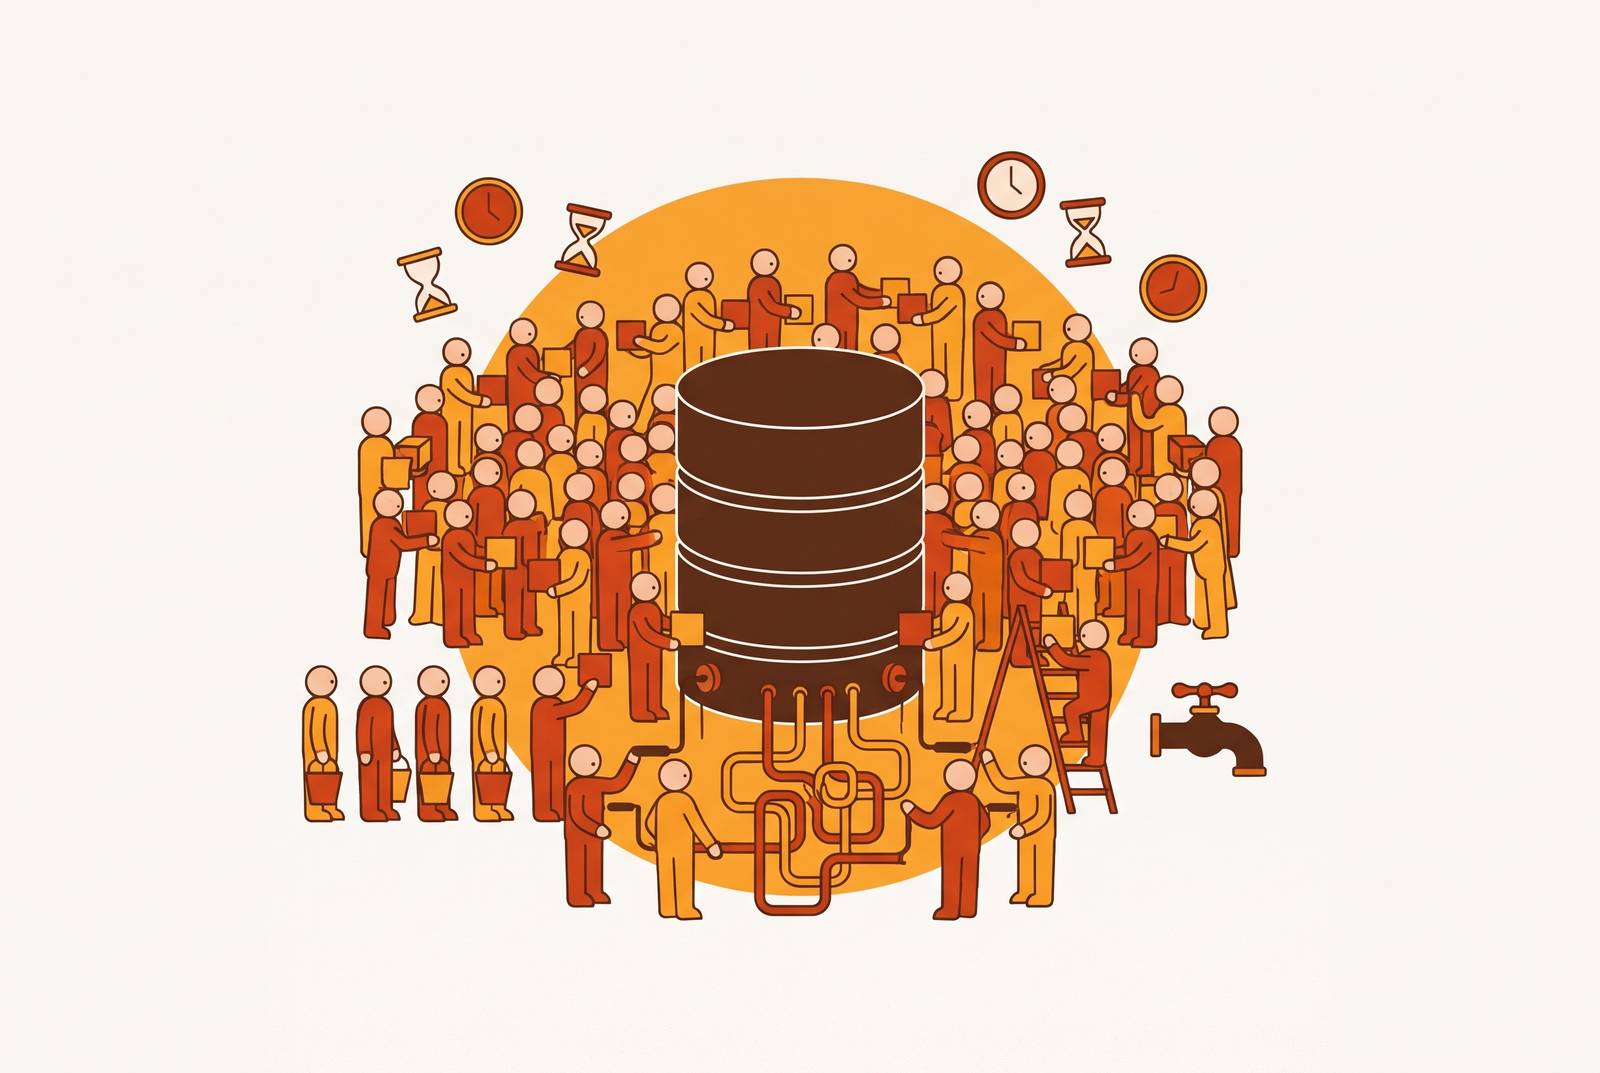
For an eighty-person startup, a database interface for non-technical teams needs more than an easy way to view tables. It needs SQL-free access, metric definitions that people share, and permissions that let them answer routine questions safely. Without that governed self-serve layer, engineering and analytics become the company’s human database interface, and the work they were hired to do loses out to the work everyone else needs first.
The structural reason engineering and analytics time defaults to reactive work
A business question becomes an engineering task when the person asking it cannot reach the data or use an agreed definition of the answer. Someone who can write SQL must translate the question, choose the right logic, and return the result. That person is now a mandatory stop. The bottleneck is there before anyone opens a ticket. It comes from the way access is arranged.
Adding analysts gives more people the ability to fulfill requests, but it leaves that arrangement intact. As business headcount grows, more people bring questions, and routine work keeps entering the same queue. What happens when a team hired to explain the business must first fetch every number? Analysis becomes logistics, with skilled people spending their time moving questions and answers between teams.
Ad hoc query fulfillment as the largest single consumer of analytics capacity
The most direct expression is the ad hoc request queue, the largest single drain on analytics capacity in this pattern. A stakeholder needs a number, an analyst writes a query, and the answer prompts another question. Could it use a different filter? Could the same result be pulled for another group? The “quick pull” is not a task so much as the opening message in a thread.
Without a reusable framework, each turn in that thread can require manual SQL, filter changes, or spreadsheet patching. Similar questions produce slightly different queries, so duplicated effort also creates room for inconsistent answers. The next request rarely comes when it is easy to stop. Analysts move between tools and queries while work on modeling or experiment design waits for an uninterrupted stretch. The queue consumes attention as well as execution time.
This is the report factory dynamic. An analyst can give a small number of requests genuine analytical depth, or fulfill many requests with surface-level chart pulls. A growing queue favors the latter because sending a chart closes a request, while looking closely at the data can raise more questions. An intake process can decide which request comes first, but it cannot make routine questions answerable by anyone else.
Dashboard and pipeline maintenance as a structural tax that never clears
Requests are only the demand side of the problem. Dashboards, reports, and the pipelines underneath them need upkeep even when nobody asks for anything new. The team cannot just finish the queue and start strategic work, because the machinery that answered yesterday’s questions needs care too. Maintenance has no tidy closing ceremony. A dashboard remains useful only while the data and logic behind it remain usable.
The burden also extends beyond what people actively use. Data teams can spend hours maintaining unused pipelines, while poorly understood dependencies make removal feel riskier than upkeep. Large organizations accumulate databases and pipelines that no one fully understands, illustrating where this pattern can lead. The choice becomes a known maintenance bill against an unknown cost of removal.
For a smaller team, the crucial point is that maintenance and ad hoc work draw on the same people. They are simultaneous claims on fixed headcount. Time spent fixing a dashboard leaves less time for requests, and urgent requests leave less time for the work that keeps dashboards running well.
Building and maintaining internal admin panels as misallocated product engineering time
The same dependency reaches beyond analytics when support, finance, or operations need to view or edit records. Without safe, permissioned access, product engineers are asked to build an internal admin panel. At first, this can sound like a small interface project. Then the access rules arrive. Support needs customer data, finance needs billing data, and admins need access to more of it, so each combination adds logic to the build.
A custom panel can take several weeks to months, and shipping it does not end the obligation. Schema changes and new requirements bring engineers back to maintain it. The interface may be internal, but the work competes directly with product development. Every week spent on an internal dashboard is unavailable for features that distinguish the company’s product. Calling it a side project does not give it a separate supply of engineers.
Asking an engineer to run SQL makes the work unscheduled, while direct database access for non-technical staff leaves unresolved who can see or change what. Standing write roles granted so on-call engineers can fix incidents quickly can remain active after the incident ends. Access and internal tooling are therefore parts of the same design problem. A panel is not merely a screen over some tables, because someone must also decide who can see or change what, and keep those decisions current.
Metric definition conflicts as an invisible engineering cost hidden inside meetings
Even when people can obtain data, they may not agree on what it means. Marketing, finance, and product can each produce a report labeled “revenue” or “active users” while using different filters or joins. The underlying records may be correct. The disagreement lies in the definition applied to them. Another data pull alone cannot settle it. Someone has to reconstruct how each answer was made.
That reconstruction is skilled analytical work devoted to reconciliation. An analyst compares query logic to explain why two questions that seemed the same gave different numbers. Meanwhile, the cost is hidden in meetings and follow-up requests and goes unplanned as an engineering task. Is the dashboard wrong, or is the question different? Without an authoritative definition, even that distinction becomes work the team must repeatedly perform.
BARC’s assessment describes how self-service reporting without governance can produce differently prepared data sets, inconsistencies, mistakes in analysis, falling data quality, and silos. More access by itself can therefore deepen the problem. Once stakeholders distrust dashboards, they ask engineers to pull the “real” numbers directly, feeding the ad hoc queue again.
What the aggregate looks like: the strategic work that does not get done
These categories converge on the same calendar, though they appear under different labels. Ad hoc fulfillment looks like stakeholder support, maintenance looks like infrastructure work, internal panels look like engineering delivery, and metric reconciliation looks like coordination. Each can be justified on its own. Together, they consume the capacity intended for modeling, roadmap work, capability building, and strategic analysis.
A support team may really need a record, and a broken pipeline may really need to be fixed. Routine needs can keep drawing specialists into the work. If they do, strategic work is structurally displaced. A delay suggests the team will catch up after an unusual interruption, whereas this queue is part of normal operations.
Some users abandon an inquiry rather than wait, and some make important decisions without the information they wanted. Those missing questions leave no report for an analyst to count. The opportunity cost therefore includes both unfinished technical work and decisions made with less evidence. An hour spent repeating a dashboard pull cannot go into the model that would make the pull unnecessary, while an hour spent reconciling definitions cannot go into analysis that helps someone choose what to do next.
Why the usual tactical fixes do not change the ratio
Intake forms, prioritization rubrics, documentation, and office hours are reasonable responses to an overloaded team. They cut down on noise, help people know what to expect, and make requests easier to handle. Their limitation is that they organize a dependency without removing it. A business user who still cannot answer a routine question must return to the data team, however well the request is formatted.
Prioritization determines order, though urgent stakeholders can escalate past it. Documentation can answer repeat questions in principle, but people do not consult it reliably, so familiar requests reappear. Office hours batch demand into a scheduled window, leaving the underlying need for answers unchanged. The line may move at a more civilized pace, but the same people still have to serve everyone in it.
Manual reporting also leaves isolated logic behind each request, with no central place to standardize it. That means a better intake process does not, by itself, stop repeated query writing or the reconciliation that follows inconsistent results. The structural change is different. People must be able to answer routine questions without SQL, without a ticket, and without waiting for a specialist. Otherwise, process improvements can make fulfillment less painful while leaving its claim on capacity largely intact.
How do non-technical teams get database access without writing SQL, and what does that change?
With a governed self-serve data layer, business users can answer routine questions themselves, while the data team keeps control of definitions and access rules. A growing startup has more reason to choose a tool for those features than for ease of browsing alone. A SQL-free interface lets people run queries, shared definitions help their answers agree, and permissions set who may use the data. Each solves a different part of the problem.
For ad hoc work, routine questions leave the queue. Analysts can spend their time on questions that need judgment, including experiment design, causal analysis, and definitions whose meaning is truly unclear. Shared metrics also remove a source of repeat reconciliation by defining “revenue” once for all teams. This does not abolish difficult questions about meaning.
Permissioned, read-only access to production data, or a governed read replica, addresses routine viewing without giving non-technical staff unrestricted database access. Read-only access, however, neither serves as an editing tool nor itself revokes write privileges left over from incidents. Those remain access-control responsibilities. Prophecy’s model describes a broader shift in engineering from building each report or admin panel to keeping a governed platform running so others can build from it. Maintenance changes composition rather than disappearing, with less bespoke fulfillment and more work on shared infrastructure.
That distinction is the condition for success. As the BARC assessment makes clear, self-service without governance can reproduce inconsistencies and silos. The data team must still maintain definitions and access rules, so this is a change in responsibility. Whether people use the tool is not enough to show whether the change worked. The useful measure is how much of the team’s week becomes strategic rather than reactive, and whether the models, capabilities, and analyses previously crowded out finally get started.