Why the Data Team Becomes a Reporting Factory and How to Stop It
Self-serve analytics only works when governance moves in before sprawl begins.

A product manager needs conversion numbers by Thursday. Finance needs a margin breakdown for the same meeting. Customer success needs churn cohorts pulled before the board sees them Friday morning. All three requests land in the same queue, behind the dashboard maintenance that was already scheduled and the ad-hoc SQL tickets that came in last week. One team, three departments, one line to stand in.
This is not a story about anyone failing. The product manager did nothing wrong by asking. The data team didn't drop the ball by not getting to it sooner. The decisions those three requests were meant to inform get made anyway, without the numbers, because numbers that arrive after the meeting are worthless no matter how accurate they are.
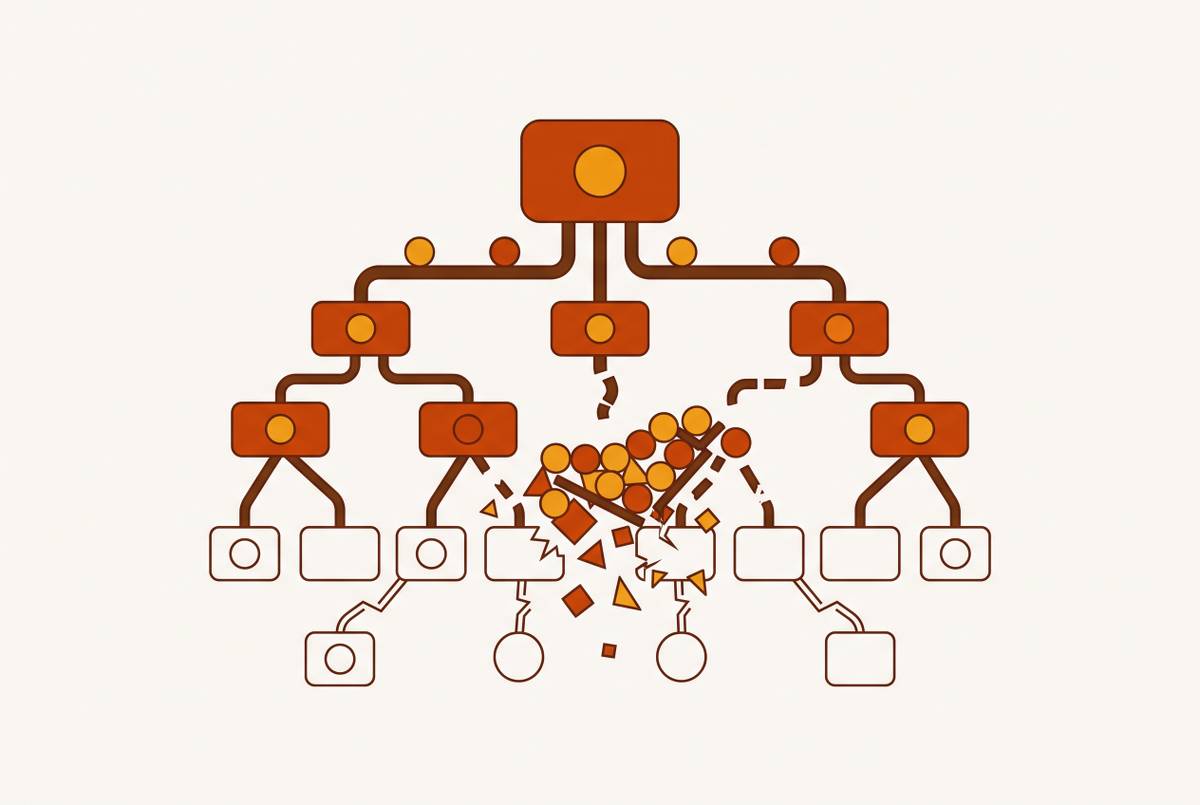
That's the reporting factory, and it forms through one structural choice: every data question in the company routes through a single central team. Demand has no ceiling. A company can always generate more questions than a database team can generate answers. Capacity, meanwhile, is fixed by headcount and by the hours in a day. Uncapped demand against fixed capacity produces a queue, every time, regardless of who's staffing it.
The factory also feeds itself. A team spending most of its week on routine reporting has no hours left for the work that actually changes the business, like predictive modeling or fixing the pipeline architecture causing half the delays. That work doesn't get skipped once. It gets bumped every sprint, forever, because the ticket queue never hits zero long enough for anyone to look up.
Why routine requests consume disproportionate data team capacity
Most of what fills that queue isn't hard. Customer segmentation, recurring metric calculations, a standard transformation someone needs run again with this month's numbers swapped in. None of it demands deep architectural skill. All of it demands someone's afternoon.
The work isn't technically difficult, it's technically gated, which traps routine requests behind the same access barriers as hard ones. Someone has to write the SQL. Somebody has to stage the data. Somebody has to package the output into something a non-technical stakeholder can actually read. Even a five-minute question requires a person with database access and query skills to sit down and answer it. The simplest requests still compete for the same scarce hours as the hard ones.
There's a second cost buried in this: dashboard queries often run directly against the production database, the same one powering the actual product. That's not free, and it's not neutral.
Picture a query that scans two years of transaction history to build a trend chart. That query pulls a huge amount of data through the database's cache, and in doing so it evicts the "hot" data, the records the live application needs on every request. Once that happens, ordinary API calls, the ones with nothing to do with reporting, slow down for several minutes while the cache refills. A customer trying to check out somewhere else in the product takes the hit for a dashboard they'll never see.
Connections work the same way. A database serves a limited pool of simultaneous connections, and a long-running analytical query holds one open for the duration of the scan. Opening a handful of dashboards at once drains the pool dry. The application then starts timing out on requests that have nothing to do with analytics.
The usual fixes buy time without closing the gap. Adding indexes speeds up some queries but not the heavy scans. Standing up a read replica offloads the load, but replicas lag behind the primary by design. A customer takes an action, opens a dashboard a few seconds later, doesn't see the update yet, and files a support ticket convinced something broke.
Then there's sheer volume. At many mid-to-large organizations, dashboard counts run into the hundreds or even the thousands, built up over years by different teams solving different problems. Each one needs updating when a schema changes. Each one duplicates logic some other dashboard already has, somewhere, under a different name. That sprawl becomes its own maintenance backlog, layered directly on top of the queue already described above.
Why adding analysts does not break the cycle
The obvious fix is to hire more analysts. More hands, shorter queue. Except demand doesn't hold still while supply grows: more analysts means more reports become possible, and more reports become possible means more reports get requested. Capacity expands and demand expands right alongside it.
The structural incentive never moves. As long as every data question still has to pass through the central team, that team stays the bottleneck no matter how many people sit on it. Headcount changes the size of the queue. It doesn't change the fact that there's a queue.
The strategic work that justified building a data team in the first place, the modeling, the architecture, the pipeline reliability, keeps getting pushed to next quarter, because every new analyst gets absorbed into routine requests the moment they're onboarded.
Trust takes a hit too, and headcount doesn't fix that either. Without one shared definition of each metric, more analysts just means more people independently computing "active users" or "churn" their own way. More dashboards disagree with each other, not fewer, and a leadership team trusts the data less the bigger the team gets.
Where self-serve analytics rollouts break down
Self-serve analytics is the industry's answer to exactly this problem. The data team keeps ownership of the infrastructure and the definitions, but stops being the only door anyone can walk through to get a number. In theory, a product manager pulls their own conversion data and finance builds its own margin view, and the central team never sees a ticket for either one.
Most rollouts don't get there. A 2025 analysis from Dresner found that 32% of organizations rated their self-service BI effort "very successful," 41% "moderately successful," and only 6% reported outright failure. Most places do land somewhere on the success spectrum. The trouble is that "moderately successful" still leaves a lot of organizations short of what self-serve promised, and the gap tends to trace back to the same three structural failures.
The first is mistaking access for literacy. Handing someone a tool doesn't teach them how to frame the right question, read the output correctly, or notice when a number looks wrong. A login doesn't transfer judgment.
The second is governance arriving late. Domo's guidance on self-service rollouts is blunt about the cost: retrofitting governance after hundreds of ungoverned reports already exist is expensive and disruptive, and the common assumption that governance can simply be bolted on afterward is a dangerous one to carry into a rollout.
The third is quieter but just as damaging: the self-serve interface still requires SQL. Giving someone a tool that only responds to query syntax leaves the bottleneck in place, just wearing a new label. The moment that tool can't answer a follow-up question, the user gives up and files a ticket, and the data team is right back to being a human API, just with extra software in between.
Domo's own best-practices guidance lists the failure patterns that show up again: inconsistent metrics across teams, dashboard sprawl, data quality problems that surface only after a decision has already been made on bad numbers, security gaps from row-level permissions that aren't enforced consistently, and weak adoption when training teaches people which buttons to click instead of how the workflow actually fits their job.
The governance gap: how ungoverned self-serve creates a different, harder bottleneck
Ungoverned self-serve doesn't remove the data team's burden. It swaps one burden for a worse one. Instead of answering questions, the team spends its time cleaning up the mess of conflicting answers other people already produced, and that job is slower and harder than the one it replaced.
Once every team can build its own reports with no shared definitions underneath them, the data team picks up a job nobody assigned them: refereeing metric disputes, debugging dashboards they never built, explaining to a VP why two reports pulling from the same source table show two different churn numbers. A 2026 guide on self-service analytics found that without a shared definition, five people compute revenue five ways, and the organization ends up arguing about whose number is right instead of acting on any of them.
The same disagreement happens with real metrics too. Marketing, finance, and customer success often each track a version of churn relevant to their own function, and without a shared definition layer reconciling them, each team's number looks authoritative in isolation and contradicts the others the moment they're compared side by side.
A confident, polished, wrong dashboard does more damage than no dashboard. Leadership makes a real strategic call based on a flawed analysis simply because the chart looks clean and the person presenting it sounds sure. No data at all would have at least left the decision open to other input. A wrong answer delivered with confidence forecloses that.
Locking a self-serve tool down too tightly causes its own failure. Lock a self-serve tool down so tightly that it's barely more accessible than filing a ticket with IT, and adoption collapses right along with the goodwill behind the rollout. The bottleneck survives. The company has just added a software license on top of it.
Domo's guidance names the root of both failures as the same thing: an ownership gap. Self-service creates a gray zone between IT and the business, and without a written answer to who owns source connections, who owns metric definitions, who owns access provisioning, and who owns dashboard creation, that gap opens fast. Verbal agreements about "who's responsible for this" tend to evaporate the moment the person who made them changes roles.
What a semantic layer does beyond a self-serve tool
A governed semantic layer sits between the raw data and whatever interface a person is using to look at it, whether that's a dashboard, an ad hoc query, or an AI assistant. It defines every metric, every dimension, and every access rule exactly once, and every tool built on top of it inherits that same definition automatically. This is what separates self-serve that actually works from self-serve that generates chaos.
Without that layer, every tool re-derives its own joins, its own grain, its own version of what "churn" means, independently, query by query. Nothing forces two tools to agree, so asking the same question in two different tools can produce two different answers even when nobody made a mistake.
With the layer in place, "churn," "active user," and "net revenue" get defined once, by the data team, and every team that self-serves inherits that exact definition. Nobody can accidentally spin up a competing version, because there's nowhere for a competing version to live.
Permissions belong in that same layer, not bolted onto the interface on top. Row-level and role-based rules applied before a query ever runs mean a user only ever sees what their role permits, no matter which tool or screen they're using to look.
That matters most in multi-tenant settings. A user acting on behalf of one customer account can't construct a query that pulls another customer's rows, because the semantic layer never compiles a query like that. The restriction lives below the interface, where no amount of clever querying can route around it.
The same structure makes AI-assisted querying trustworthy. A natural language interface grounded in a semantic layer can only select from a governed set of metrics that already exist. It can't invent a definition on the fly, which directly answers the concern most practitioners raise about AI tools: that a hallucinated number might slide into a board deck looking exactly as credible as a real one.
The data team's role once the structure changes
Once the semantic layer handles governance and a self-serve interface handles the routine questions, the data team's job changes shape. It stops being the answer to every question that comes in and becomes the architect of the system that answers those questions on its own.
That split has clear edges. Data teams own the source connections, the metric definitions, and the access policies. Business analysts own dashboard creation, but only inside the guardrails the data team already set. IT and security own access provisioning. Each role has a boundary, and no single team is left holding the gate for every routine question that walks up to it.
Success here looks different than it used to. Dashboard count isn't a win, it's often a warning sign of sprawl: the real signals are a drop in ad hoc requests hitting the queue, real usage of self-serve tools by people outside the data team, and data team hours actually showing up on strategic work instead of getting absorbed by tickets.
For data teams at companies that are still growing, a database-native tool that connects straight to the infrastructure already in place, without requiring a whole separate BI stack to stand up and maintain, makes this shift realistic. The data team defines the governed views and the permissions once. After that, product, sales, marketing, and support query that data directly, with no SQL and no ticket in between.
The same row-level permission model that protects a production database in a transactional context carries over here. Non-technical users get safe, scoped access to exactly the data their role calls for, and nobody ever has to hand them a raw credential or a superuser login to get there.