Why Data Democratization Efforts Stall at Mid-Size Companies
Most mid-size companies' self-serve data tools sit unused while request queues grow.
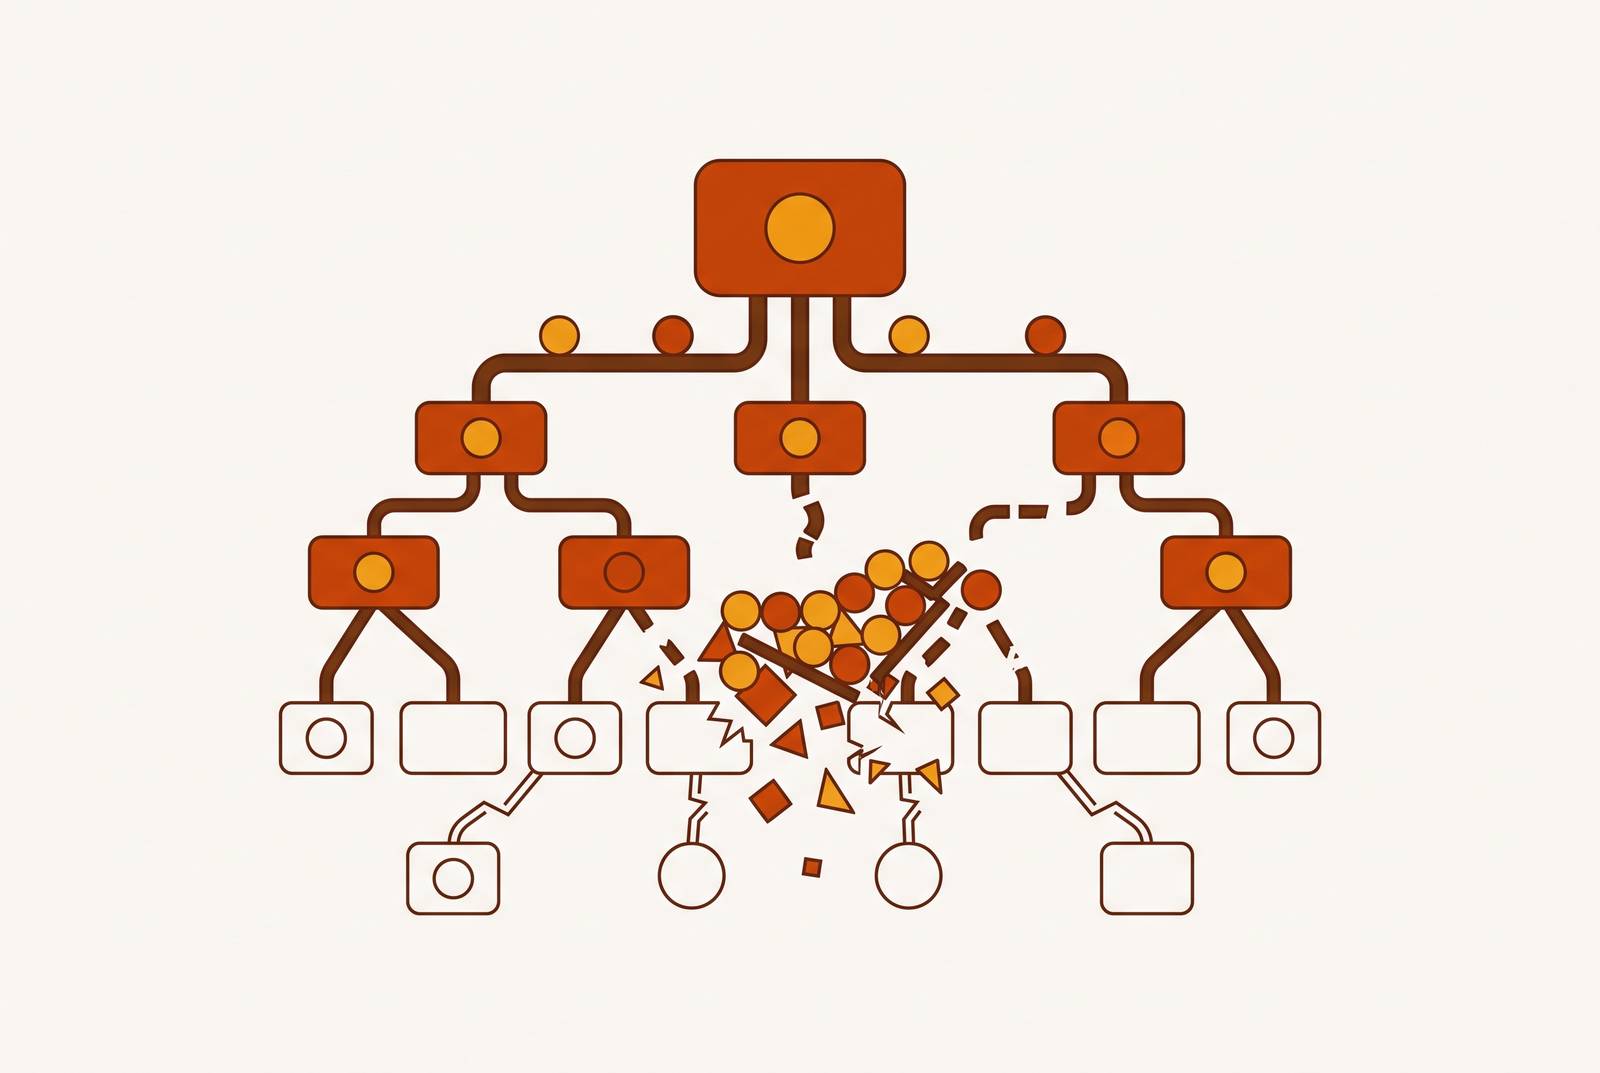
Data democratization was supposed to work like this: give non-technical teams direct access to data, decisions get faster, and the data team stops fielding requests and starts doing the harder, higher-value work. Fifteen years and a lot of software spend later, that's not what happened at most mid-size companies. The data team still fields requests. The queue hasn't shrunk. Most of the "self-serve" tool licenses are sitting mostly unused.
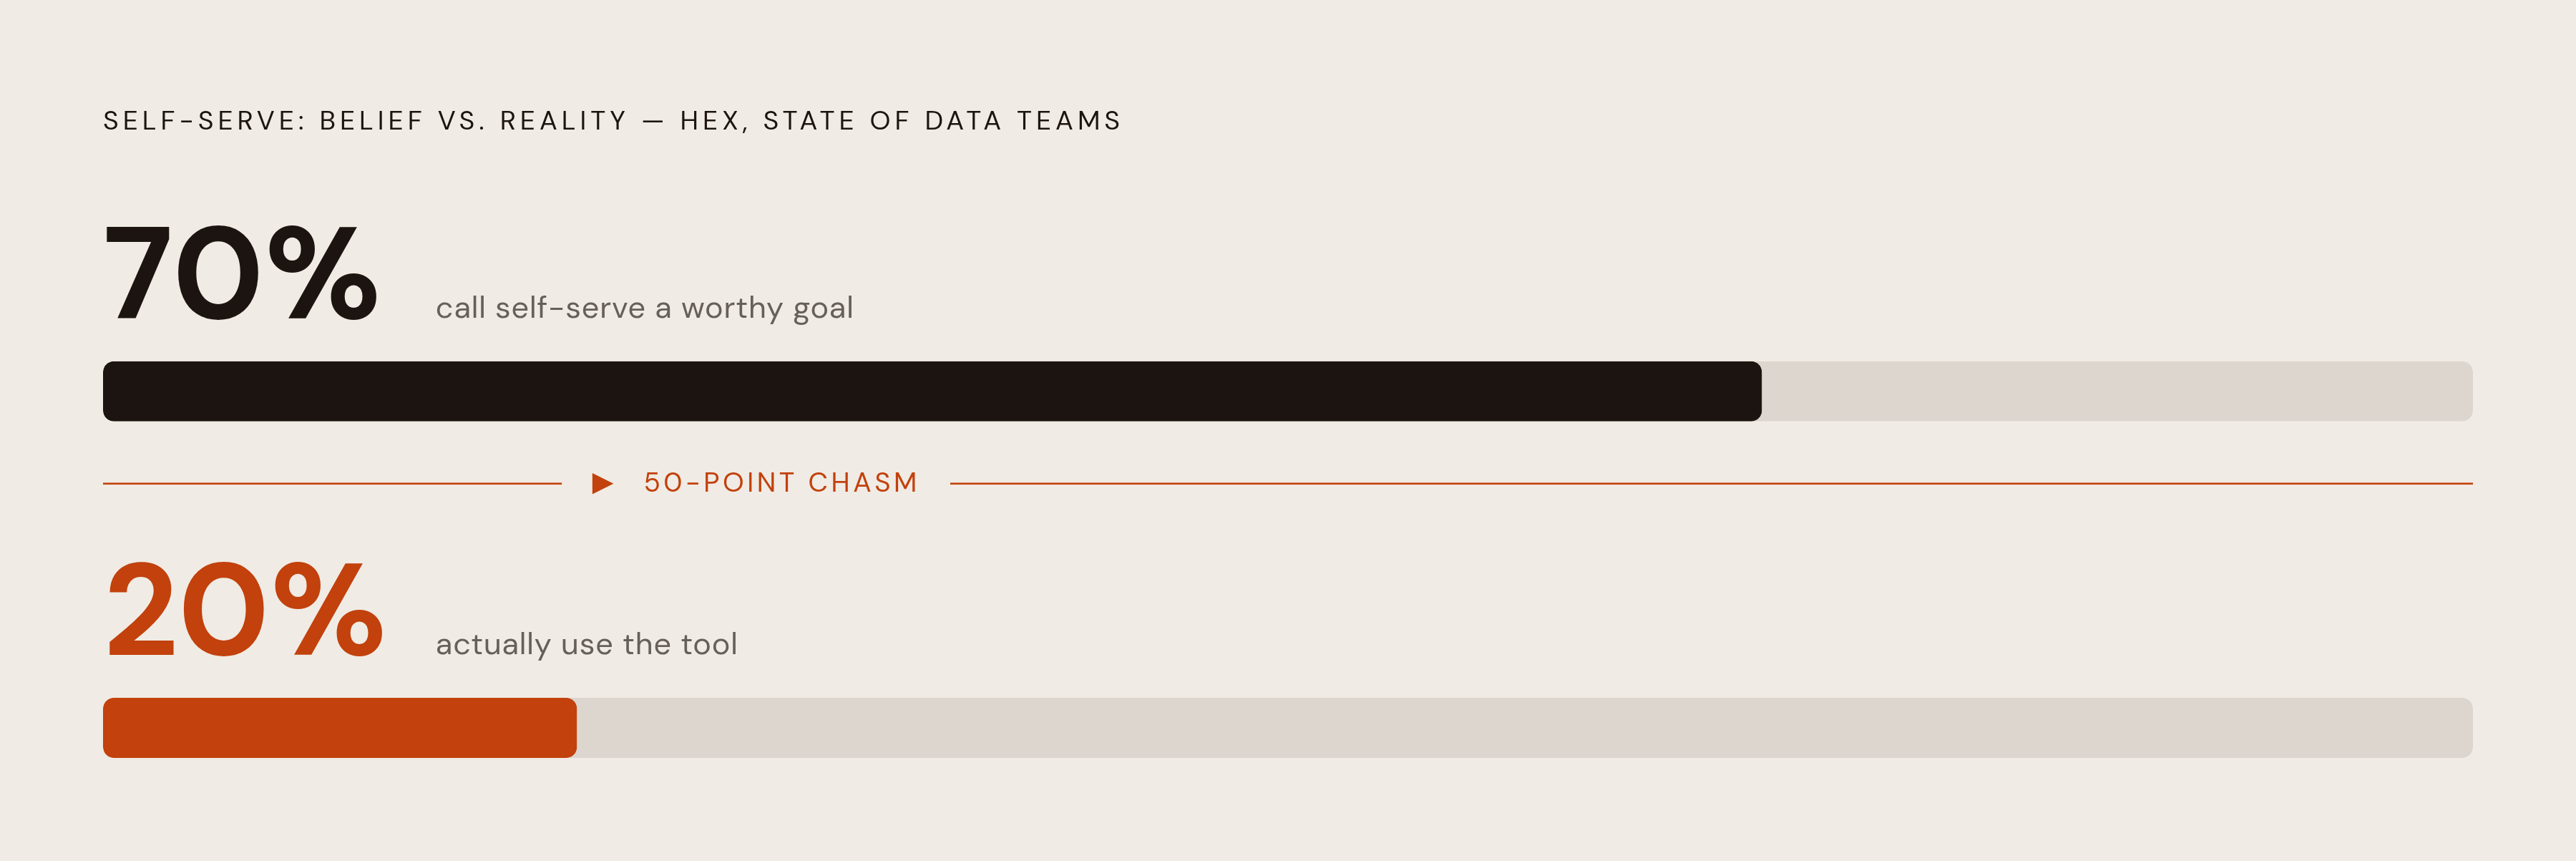
Research from Hex's State of Data Teams study puts a number on the gap: 70% of data professionals call self-serve a "worthy goal," but actual tool adoption lands closer to 20%. That's a program that mostly isn't working, dressed up in a strategy deck that says it is.
The same research found 53% of data professionals in 2025 were unhappy with their analytics product or actively considering switching it, the majority view rather than a disgruntled minority. That's the majority view, not a disgruntled minority.
Meanwhile, the belief in the promise hasn't gone anywhere. Leadership investment in the vision hasn't gone anywhere, even as adoption numbers fail to match it. Executives believe in the promise, the workforce agrees it's worth pursuing, and the gap between aspiration and reality keeps widening. Someone signed off on the budget. Someone has to explain why it isn't working.
Mid-size companies, roughly 50 to 200 people, feel this the hardest. They're too big to route every question through one overworked analyst. They're too small to build a dedicated BI team that can absorb an endless stream of requests. They're stuck in the middle, paying for tools that promise independence and getting dependency instead.
Take the position most leadership teams resist: the tool is almost never the reason self-serve fails. The stall lives in the data itself and in how the rollout got handled. Buying a new platform to fix that is like buying a better filing cabinet to fix a filing system nobody agreed on. If the vendor is swapped, the filing system stays exactly as broken, just in a nicer cabinet.
The market is happy to sell you the opposite story. Enterprise-grade BI platforms come with real sales conversations and real budgets attached. Per-user tools look cheaper on the surface, until the AI features everyone actually wants get walled off behind separate capacity tiers you have to pay extra for.
The dollar figures aren't small. Vendr's data across a 355-deal sample puts average annual spend on one major enterprise BI platform around $150,000, with list pricing starting near $60,000 a year for the standard tier. For a company with 50 to 200 employees, that's a real bet, not a rounding error.
The bet often doesn't pay off. A case documented by Observable HQ describes a software development company that invested heavily in a traditional BI tool, spent weeks building a self-service interface for its team, and ran training sessions to get people comfortable. A few months later: five out of 100 intended users were actively using it.
Five. Out of a hundred.
That's a marginal adoption outcome dressed up as a rollout. Switching tools doesn't fix it. The new platform gets the same configure-and-abandon rollout, lands around the same 20% actual adoption the broader research documents, and the request queue reappears right on schedule.
The tools aren't the villain. But no amount of tool-switching answers the actual question: why aren't users self-serving? The data itself holds that answer.
How ungoverned data erodes trust
Two people, two departments, same question about revenue. They get two different numbers. Neither is technically wrong. They're just working from different definitions.
That's metric drift, and calling it a bug lets everyone off the hook too easily. It happens when nobody enforced a single authoritative definition. Research from dbt points to the mechanism directly: ad hoc SQL queries running everywhere, spreadsheets uploaded from a dozen different sources, each producing its own version of "the truth." Confidence in any single output erodes fast once people start noticing the numbers don't match.
This isn't a fringe failure mode. Gartner's report found 80% of data governance initiatives are expected to fail by 2027. Most companies are operating inside that norm, acknowledged or not.
Dashboard sprawl makes it worse. Hundreds of overlapping reports, no clear owner, no policy for retiring the outdated ones. Users open the tool looking for an answer and instead find six dashboards that might be relevant, no way to tell which one is current, and no confidence in any of them.
If twelve different tables could plausibly answer a revenue question, and nobody ever agreed on which one is authoritative, the software doesn't know either. The ambiguity existed before the tool arrived, and it'll still be there after the next tool arrives too.
The AI layer sitting on top of all this doesn't fix it. It amplifies it. An AI assistant pulling from ungoverned data doesn't solve the underlying quality gap. It picks a table and a definition confidently, and the user has no way to know if it picked the right one. A confident wrong answer is worse than a slow right one, because at least the slow one gets checked before anyone acts on it.
Real governance looks like a semantic layer that enforces one set of metric definitions across the company, naming conventions with a named owner attached to each one, and a regular cleanup process for retiring dead dashboards. That's organizational work. No vendor ships that pre-installed, and no procurement cycle buys it off a price sheet.
Why the configure-and-abandon rollout guarantees a helpdesk outcome
Picture the standard rollout: the data team configures the tool, runs a training session, tells the business teams to go self-serve, and steps back to focus on other work.
What happens next is predictable. Users open the interface and don't know where to start. The tool feels overwhelming relative to the one specific thing they actually wanted to know. Some give up. Others do the only other thing available to them: file a support ticket with the data team.
This has a name: blank prompt syndrome. The user understands their question perfectly well in plain business language. What they can't do is translate that question into a query, a filter, a join, whatever the tool demands. The interface assumes technical fluency the user doesn't have and was never going to develop from one training session.
The data team becomes a helpdesk. Not by choice, by default. A backlog builds of vague, time-consuming requests from people who technically have access to the tool but functionally can't get an answer out of it on their own.
Trace the ticket cycle: a business team has a question, it enters a queue, and an analyst eventually writes the query, checks it, formats the output, and sends it back days later. Best case. Often the decision the question was meant to inform has already been made by the time an analyst delivers the answer.
Observable HQ's research on this points to frustration building on both sides at once. The business team is frustrated by the wait. The data team is frustrated by doing the same repetitive, low-leverage work over and over. Analytics engineers and data scientists, people hired for genuinely difficult analysis, end up spending a meaningful chunk of their week answering variations of the same recurring question instead.
More training sessions won't fix this, and that's the tell that it's not a training failure. It's a structural mismatch: the tool was built for one kind of user, and the person actually asking the question is someone else.
Why most BI tools were designed for specialists, not the people they're supposed to serve
Looking at who the dominant BI platforms are actually built for makes the pattern obvious. The specialist assumption is baked into the product from the start.
One major platform's hero user is the developer modeling the data warehouse in its proprietary modeling language. Another's hero user is the sophisticated analyst building intricate, layered dashboards for the rest of the company to consume. A third's hero user is the enterprise BI developer producing polished, scheduled reports.
Notice who's missing: the product manager who needs one answer before a 2pm meeting. The sales rep trying to check a number. The ops coordinator who just wants to know if a number is trending up or down. None of these tools were built with that person as the primary user, even though that person is exactly who "democratization" was supposed to serve.
Product roadmaps followed the specialist assumption for years. Features got deeper and more powerful for expert users. They stayed just as inaccessible for everyone else. Adoption stayed flat. The queue kept growing.
Part of the problem is that "business user" isn't one skill level. A business analyst at one company might write advanced SQL comfortably. Someone with the identical job title at another company has never opened a query editor and works exclusively off pre-built dashboards. A tool has to meet users wherever they actually are on that spectrum, not at a single assumed skill level, and most weren't built with that flexibility in mind.
Some platforms have real governance strengths. Git-based development branches and a shared modeling layer are genuinely useful discipline. But for the marketing or sales person opening that tool, the experience depends entirely on how thoroughly someone modeled the data before they ever logged in. There's no path for them to explore a new question that nobody anticipated. They're boxed in by whatever got built in advance.
AI chat features have started showing up across the market to soften this. One major platform's conversational assistant, powered by Gemini, reached general availability in November 2025, and because it's grounded directly in that platform's existing model, that underlying model sets the ceiling on the chatbot's quality. Another vendor expanded its conversational agent into a four-agent suite covering modeling, visualization, and code, announced in December 2025. A third platform's AI assistant handles conversational follow-up questions within a session but runs into trouble with deeper causal questions, "why did this change?", the kind that require reasoning the underlying semantic model wasn't built to support. For at least some platforms, the most capable AI features sit behind pricier tiers well above the standard per-user pricing.
Having an AI chat box isn't a meaningful differentiator anymore. Nearly every BI vendor has bolted one on by now. What actually separates these tools is whether the whole platform enforces one consistent set of definitions, not whether it has a chat interface. A clever chatbot sitting on top of ungoverned, inconsistent data doesn't fix what's underneath it. It just answers confidently while being wrong, which is worse than not answering.
What shadow analytics reveals about where users go when self-serve fails them
When the official tool doesn't answer someone's question, they don't stop having the question. They go find the answer somewhere else.
That "somewhere else" usually means spreadsheets built off manual data exports, numbers copied and pasted between systems, or results dropped into an AI chat tool for a quick summary. Shadow analytics happens at most companies whether leadership knows it or not.
Sensitive data leaves the governed environment every time this happens. The data ends up sitting in places nobody's tracking, which makes it harder to control who has access to it.
The official self-serve tool produces only a thin layer of governance, and that thinness is what allows a messier reality to persist alongside it. The dashboard exists. The exports exist. The shadow spreadsheets exist. When a decision gets made, nobody's entirely sure which version of the numbers it was actually based on.
Analytics8's research describes this as the "last mile" problem: users technically have access to the data, but they still end up relying on ad-hoc exports or a back-and-forth conversation with the data team to get a real, trustworthy answer. Access alone was never the whole fix.
Shadow analytics isn't a character flaw. Nobody's doing anything wrong by building their own spreadsheet. It's a signal. It says the person had a real need, the official path didn't meet it, and they improvised because that's what capable people do when the sanctioned tool fails them. A policy that blocks the workaround doesn't fix anything. An access model that removes the need for it does.
Putting the last two sections together brings the actual stalled state most mid-size companies are living in into focus: the data team is buried under helpdesk tickets, and the business teams are quietly running their own shadow systems on the side. Both sides are working harder than they should be. Neither is getting what they actually need.
A working access model at a mid-size company
The fix is removing the human bottleneck sitting between a business question and its answer. Not eliminating the data team. Removing the data team from the critical path of routine, recurring questions, so they're only involved in work that actually needs their judgment.
Three changes matter here, and the order matters just as much as the content.
Definitions come first, before any interface gets deployed. Agree on which table answers how much revenue the company made. Write the definition down. Enforce it at the tool level so nobody can quietly override it. Skipping this step causes both a drag-and-drop dashboard and an AI chatbot to fail the same way, just with different amounts of confidence attached to the wrong answer.
The interface gets built around the actual user. The real test: can a product manager or a support lead answer their own recurring question without opening a ticket? If the answer is no, the tool isn't self-serve for that person, regardless of what the vendor's marketing page calls it.
Permissions match how the organization actually trusts people. Row-level permissions ensure different roles see what's appropriate to their function, nothing more. That's what makes broad access safe. Nobody's handing out raw database credentials or unrestricted SQL access. Access gets scoped by design, not by hoping people stay in their lane.
Mid-size companies don't need an enterprise-scale BI stack to pull this off, and reaching for one is usually the wrong move at this size. The governance work, clear ownership, defined metrics, is the actual hard part, and it's organizational, not technical. The tooling just needs to stay out of the way rather than adding friction on top.
Once that groundwork is in place, the data team's role shifts. Instead of answering the same ticket every week, they define and maintain the access layer once. That scales in a way ticket-answering never will, because a well-built semantic layer serves the whole company without new labor for every new question.
One practical shape this takes: connecting dashboards and editable views directly to the production database, with row-level permissions built in, rather than standing up a separate data warehouse or a full enterprise BI stack between the data and the people who need to see it. For a company this size, lightweight database tools with dashboards and permissions built in directly are often the more realistic path than a procurement cycle for an enterprise platform designed for a company five times the size.
None of that skips the governance step. The caveat that matters most: a simple tool sitting on top of a clean, well-defined access model beats a sophisticated tool sitting on top of ungoverned data, every single time.
The questions a mid-size team should use to diagnose where their own initiative has stalled
Figure out which root cause is actually blocking things, and fix that one first. Everything else is rearranging furniture.
Governance check. Can two people in different departments independently answer the same revenue or conversion question and land on the same number? If not, the problem is the definitions. No new tool fixes this.
Rollout check. How many users from the last tool deployment were still actively using it 90 days later? What did the people who stopped say when asked why? If the answer points to complexity or confusion, that's the configure-and-abandon pattern, not a tool failure.
Fit check. Who is the actual power user of the current BI tool right now, someone on the data team, or someone on the business side? If it's the data team, the tool has quietly become an internal reporting service run by specialists, not a self-serve layer for the people it was bought for.
Shadow analytics check. Are business teams keeping their own spreadsheets or exports running alongside the official dashboards? If yes, the official tool isn't answering their real questions, no matter how nice it looks in a demo.
Bottleneck check. How many data requests go through a human per week, and has that number actually gone down since the last tool rollout? If it hasn't moved, the human bottleneck is still there, just wearing a new interface in front of it.
The order these get fixed in matters more than it might seem. Fix the interface before fixing the definitions, and the rollout fails regardless of how good the interface is. Fix the definitions but leave the human bottleneck in place, and the rollout still fails, just more slowly and with better-looking dashboards along the way.
Get the governance and the access model right first, then choose tooling that actually matches the technical level of the people using it. Do that, and the 70% adoption the research identifies as the real aspiration stops being a talking point in a slide deck. It becomes a realistic outcome, instead of the 20% most companies are stuck with today.