Why Self-Serve Analytics Breaks Down in Practice
Metric definitions and data quality problems hide until business users spot them too late.
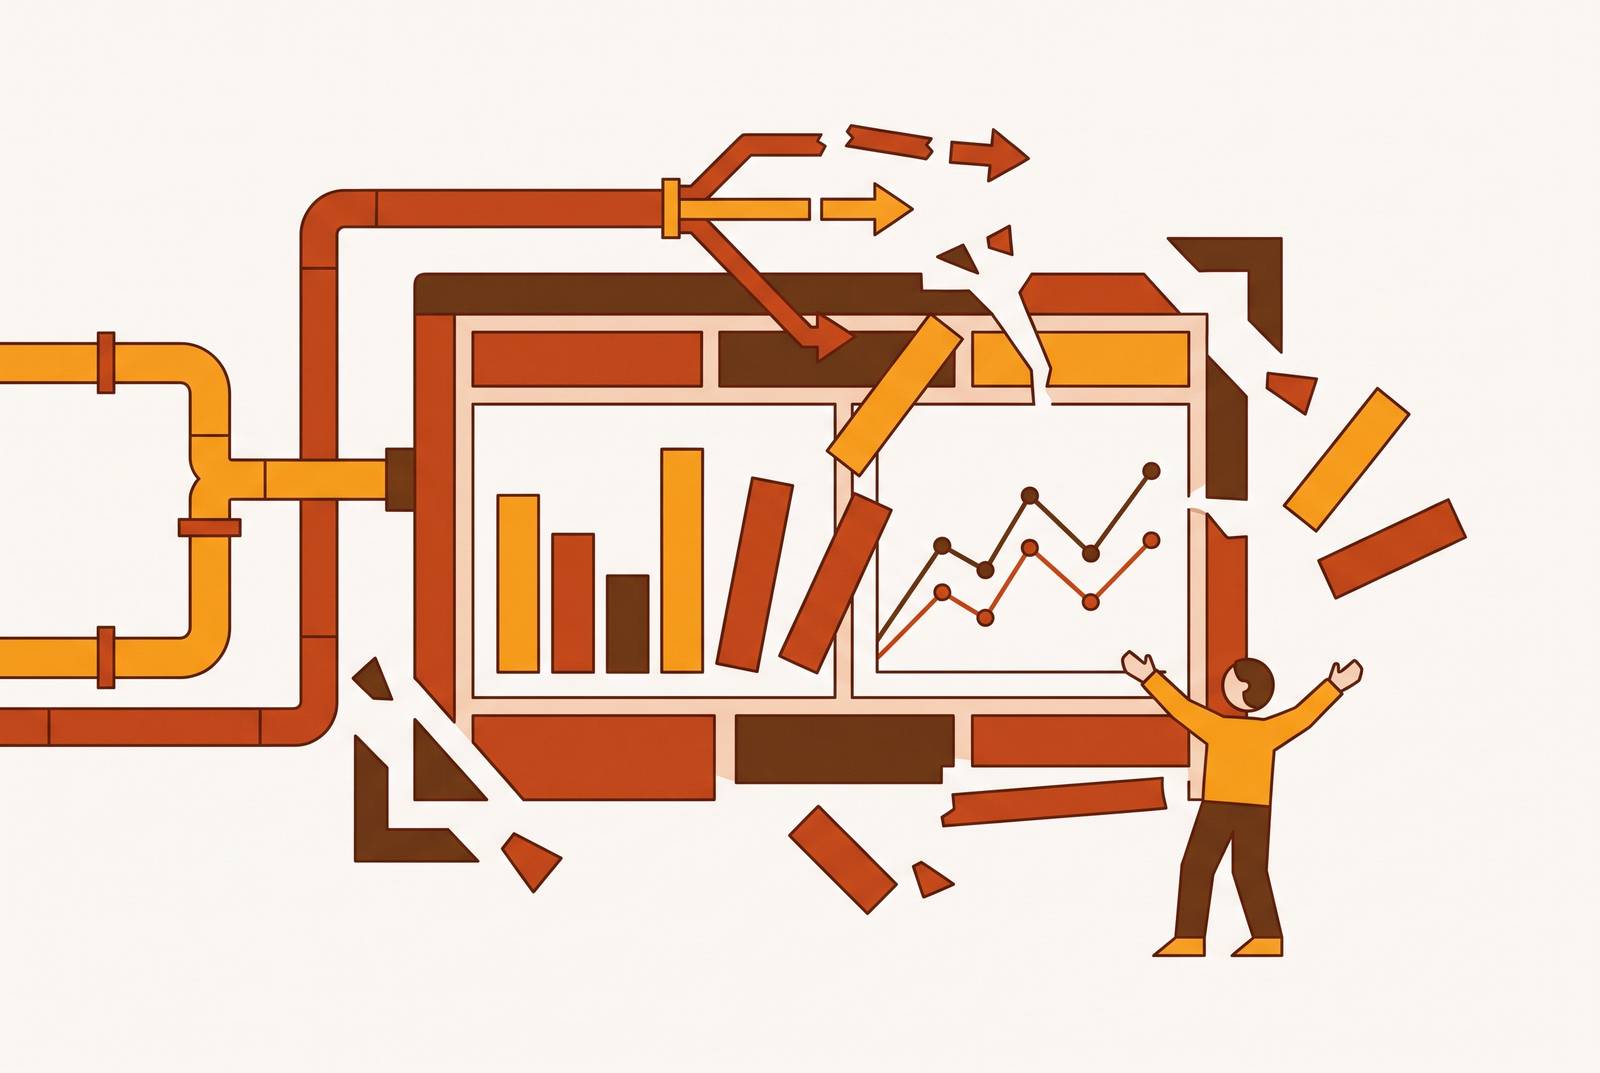
The tool works. That's the uncomfortable part.
Most organizations that buy a self-serve analytics platform are buying a product that works. They're buying something that does exactly what it says on the box: it lets a marketing manager or a sales lead build a chart without filing a ticket. And then, months later, that same manager is still emailing the analyst, because the number on the dashboard doesn't match the number in someone else's spreadsheet.
The failure sitting underneath this is a governance problem, not a tool problem. Two people ask the same question, get two different numbers, and the whole system loses their trust in a single afternoon.
None of this means self-serve analytics was a bad bet. Business teams genuinely need answers faster than a central data team can produce them, and modern BI tools are genuinely capable of closing that gap. The promise holds up. What doesn't hold up is the assumption that pointing a capable tool at a messy pile of data will somehow sort the mess out on its own.
Three symptoms tend to appear first, and they appear fast. The CMO's revenue number doesn't match the CFO's. Answers come back from the tool, but nobody trusts them enough to act on them without double-checking in a spreadsheet first. Business users open the tool, can't figure out which table actually holds the right numbers, and end up routing the question back to the analyst anyway, which is exactly the workflow self-serve was supposed to replace.
The CMO's revenue figure doesn't match the CFO's, answers come back but no one trusts them, so someone cross-checks in a spreadsheet, and business users can't figure out which table to use and route back to the analyst anyway. The data was never governed before the tool showed up. There was no single authoritative source for "revenue." No agreed definition of what "churn" means in this specific business, on this specific team, for this specific report. A self-serve tool handed a foundation like that doesn't fix the foundation. It just gives more people faster access to the cracks in it.
How ungoverned metric definitions produce contradictory answers from the same tool
Picture two people, in the same company, using the same BI tool, both trying to answer a fairly ordinary question: how's the pipeline looking by source? A sales manager builds a report. A marketing analyst builds a report. One uses slightly different filters. Both use a slightly different definition of what actually counts as a "qualified" opportunity. Both charts come out looking polished, confident, and entirely reasonable, and neither one is obviously wrong.
That's the mechanism, in miniature. When metric definitions aren't locked down and documented somewhere central, the tool has nothing stable to reason from. Every person who builds a report is quietly defining the metric themselves, without realizing that's what they're doing, and those definitions drift apart without anyone noticing until the numbers collide.
Where does the missing context actually live? Usually not in the tool. What "revenue_net" means for this business, or which table is the real source of truth for conversion, tends to live in someone's head, in an old Slack thread, or in a dbt YAML file nobody has touched in years. The self-serve tool never had access to any of that. The user was just expected to bring it with them, as if metric definitions were common knowledge instead of institutional memory.
That's worth sitting with for a second, because it reframes what an analyst actually does. Writing SQL was never the hard part of the analyst's job. Knowing which table was right, and why, was the actual value. Taking the analyst out of the loop without transferring that knowledge into something the tool can actually enforce, like a governed semantic layer, leaves the answers no faster. They get wrong, or worse, inconsistently wrong, which is harder to catch than being wrong the same way every time.
And this doesn't stay small. At enterprise scale, one table with a completeness problem doesn't stay one table. At enterprise scale, the problem compounds: what starts as one table with a completeness problem becomes five tables with conflicting numbers.
Why data quality issues stay hidden until a business user finds them
A second failure mode exists even when every metric is defined and agreed upon: the data itself might just be wrong. Not wrong in an obvious, broken-pipe way. Wrong in a quiet way, where a field that's supposed to be complete is actually missing a third of its values, and the tool has no idea.
A self-serve tool querying a field with real completeness gaps won't flag the answer as suspect. It will simply return an answer that's understated, sometimes by a lot, and it'll look exactly as confident as a correct one would.
This is why business users, not engineering teams, are so often the ones who catch data problems first, particularly across self-service analytics setups. The regional sales lead notices a customer that should be in the report isn't. Engineering finds out because someone complained, not because a system flagged it.
Data quality also isn't a project with an end date. Without continuous profiling, nobody catches the drift until a business user stumbles on it.
Part of the problem is structural, not technical. The engineering team that owns the pipeline usually doesn't have the business context to know when a number looks off. The finance team has that context in spades but doesn't own the pipeline.
Adding an AI or BI layer on top of that gap doesn't shrink the problem. It gets amplified, because the layer generates fluent, confident-sounding answers from incomplete inputs, and a non-technical user has no way to catch the error before acting on it.
How the data infrastructure beneath self-serve dashboards creates silent failures
Metric definitions and data completeness are two layers of the problem, and there's a third, sitting even further down: the actual plumbing connecting the BI tool to the source data, which introduces its own failure mode on top of everything already stacked above it, from brittle pipelines to slow performance to data loss that never shows up as an error message.
Most transactional databases were built to run a business, not to be interrogated by dozens of dashboards at once. And critically, the tool doesn't refuse to answer when those conditions get bad. It just returns a result anyway, degraded quality and all.
Growth makes this worse. As tables get bigger, older ETL processes start hitting memory limits and database deadlocks. When those pipelines fail, they tend to fail quietly: missing data produces an inaccurate report without tripping any alarm, so the dashboard looks complete while the numbers underneath it are simply short.
None of this is really a database problem, in the sense of "buy a bigger database." It's a governance problem wearing infrastructure clothing. A scalable setup needs a clean, staged separation between the operational systems running the business and the analytical layer people actually query, and skipping that separation makes scale a matter of when things break, not if. It's a matter of when.
And this is where the infrastructure story connects straight back to the organizational one. When central pipelines are slow, unreliable, or both, teams don't wait around. They build their own extracts, their own workarounds, their own side dashboards. Every one of those workarounds multiplies the number of "sources of truth" floating around the company instead of consolidating them into one.
How BI sprawl replaces the analyst bottleneck with a worse one
Self-serve analytics was supposed to kill the bottleneck of everyone waiting in line for the one analyst who could run a query. Without governance, it tends to replace that single, visible queue with something worse: a sprawling tangle of dashboards that contradict each other, shadow spreadsheets nobody officially sanctioned, and duplicated pipelines feeding all of it.
A 2025 Datalogz survey found that more than two-thirds of BI practitioners reported real challenges tied to BI sprawl, the pileup of redundant, conflicting, unmanaged analytics assets scattered across an organization. That complaint reflects most of the field. That's most of the field.
Every team that builds its own extract, or defines "active user" its own way, is effectively minting a new authoritative source, and nothing in the system reconciles it against anyone else's version. The tool didn't create this chaos on purpose. It just made it easier for everyone to create their own small, confident, disconnected version of the truth.
Somebody has to catch the fallout, and that's usually the data engineering team. Routine pipeline requests pile up, project backlogs grow, and a meaningful chunk of engineering time gets eaten by maintenance and firefighting instead of building anything new.
Shadow data spreads for the same reason weeds spread: whatever's easiest wins. When official, governed channels are too slow or too locked down, people go around them. A 2025 University of Melbourne and KPMG study found that nearly half of employees surveyed had uploaded company data to public AI tools, which is a fairly direct measure of how often "governed" and "convenient" fail to overlap.
The whole thing feeds itself. More ungoverned dashboards produce more conflicting answers. More conflicting answers erode trust further. Less trust pushes more teams to build their own workarounds. More workarounds mean more sprawl. Round and round.
Some organizations have tackled this head-on rather than let it compound. Airbnb built "Data University" to raise data literacy across the company while enforcing governance alongside it, opening up wider access without giving up stewardship. Uber went at the architecture level instead, adopting a federated, real-time governance model built on a unified data mesh, letting the company process data at scale without losing compliance along the way.
Who pays when self-serve analytics fails to stick
The costs of ungoverned self-serve don't land evenly. The engineering and data team does more work instead of less, business users quietly revert to spreadsheets, and the organization's compliance posture gets weaker every time data slips outside a governed channel.
Engineering carries the heaviest load. The dbt Labs 2026 State of Analytics Engineering Report found that most data practitioners worry about hallucinated or incorrect data reaching stakeholders, a sizable share point to ambiguous data ownership as an ongoing headache, and compute and warehouse spend climbs faster than team budgets do.
Business users, meanwhile, don't revert to spreadsheets because they dislike the tool. They revert because trust in the numbers collapsed, and a spreadsheet at least gives them the feeling of control over what they're looking at. Low adoption after a rollout is just the visible symptom. The governance gap that produced two different numbers in the first place is the actual cause.
Even teams with modern tooling in place aren't immune. Salesforce's State of Marketing, 10th Edition, found that only around a third of marketers feel fully satisfied with their ability to unify data across systems, suggesting the tool was never really the bottleneck to begin with.
Shadow data hides unauthorized access points and complicates governance efforts, particularly when it involves sensitive customer data. IBM's 2025 Cost of a Data Breach Report put the global average cost of a breach at a figure that dwarfs what most organizations spend on governance in the first place. Skipping the governance investment doesn't save money. It just moves the bill somewhere bigger, and later.
Why AI layers and better interfaces don't close the governance gap
The natural next question: doesn't AI just fix this? It doesn't. Adding an AI chat interface to a tool sitting on top of ungoverned data doesn't produce trustworthy self-serve analytics. It produces answers that are faster, more fluent, and just as wrong as before, only delivered with more confidence.
By 2026, having an AI chat box isn't a meaningful way to tell BI tools apart, since nearly every vendor has shipped one. What actually separates one tool from another is whether the whole platform, not just the chat feature bolted onto it, enforces a single, consistent set of definitions.
Speeding up how fast code and queries get written does nothing to fix governance. The dbt Labs 2026 State of Analytics Engineering Report found that a strong majority of analytics engineers now prioritize AI-assisted coding, which accelerates how fast code and queries get written. It does nothing to fix governance on its own. Interestingly, trust in data rose sharply year over year in that same report, a sign that practitioners can feel the gap between "faster" and "governed" even as both trends move in parallel.
Forrester's 2026 customer experience research predicts that a third of companies will actually damage their customer experience by rolling out frustrating AI self-service tools too early. The parallel to self-serve analytics is direct: an AI layer that can't enforce a governed definition just produces confident, unverifiable answers, and those erode trust faster than a slow analyst ever did.
That speed is the actual danger. A non-technical user has no way to catch a fluent, wrong answer generated from degraded or ungoverned data. The failure isn't a bug that occasionally slips through. It's built into how the system works: nothing in the chain is designed to catch it, so it doesn't get caught.
None of this makes AI the villain. AI is a multiplier. Pointing it at governed, well-defined data multiplies speed and access in genuinely useful ways. Pointing it at the same ungoverned mess that's been causing contradictory dashboards for years multiplies the mess instead, just faster and with better grammar.
What has to be in place for self-serve analytics to stick
Every failure mode traced here (contradictory metrics, hidden data quality gaps, brittle infrastructure, BI sprawl, AI amplifying whatever's underneath it) points back to one missing piece: governance that comes before the tool, not after it.
Building a proper semantic layer, with locked definitions and a clear owner for every metric, requires a technically capable central team. And doesn't that just reintroduce the bottleneck self-serve was supposed to eliminate in the first place? Fair question. The answer is sequencing governance and self-serve correctly, not choosing between them. It's sequencing them correctly: govern the data foundation first, then hand the tool to the business teams. The organizations where self-serve actually worked did exactly this, in that order.
In practice, that means a few things need to be locked down before rollout, not scrambled together afterward. Metric definitions need one authoritative owner, documented somewhere more durable than a Slack thread. Data completeness needs continuous profiling instead of a one-time cleanup before launch. The infrastructure connecting source systems to the analytical layer needs a real staged separation, so operational load doesn't silently degrade every dashboard sitting on top of it. AI features, wherever they get added, need to sit on top of that governed foundation instead of standing in for it.
Skipping the sequencing doesn't make the tool disappear. It just keeps doing precisely what it was built to do: return an answer, fast, confident, and occasionally wrong, to anyone who asks.