Manager Role in Scaling Data Fluency Across Teams
Managers must model data use daily or training alone won't close the skills gap.
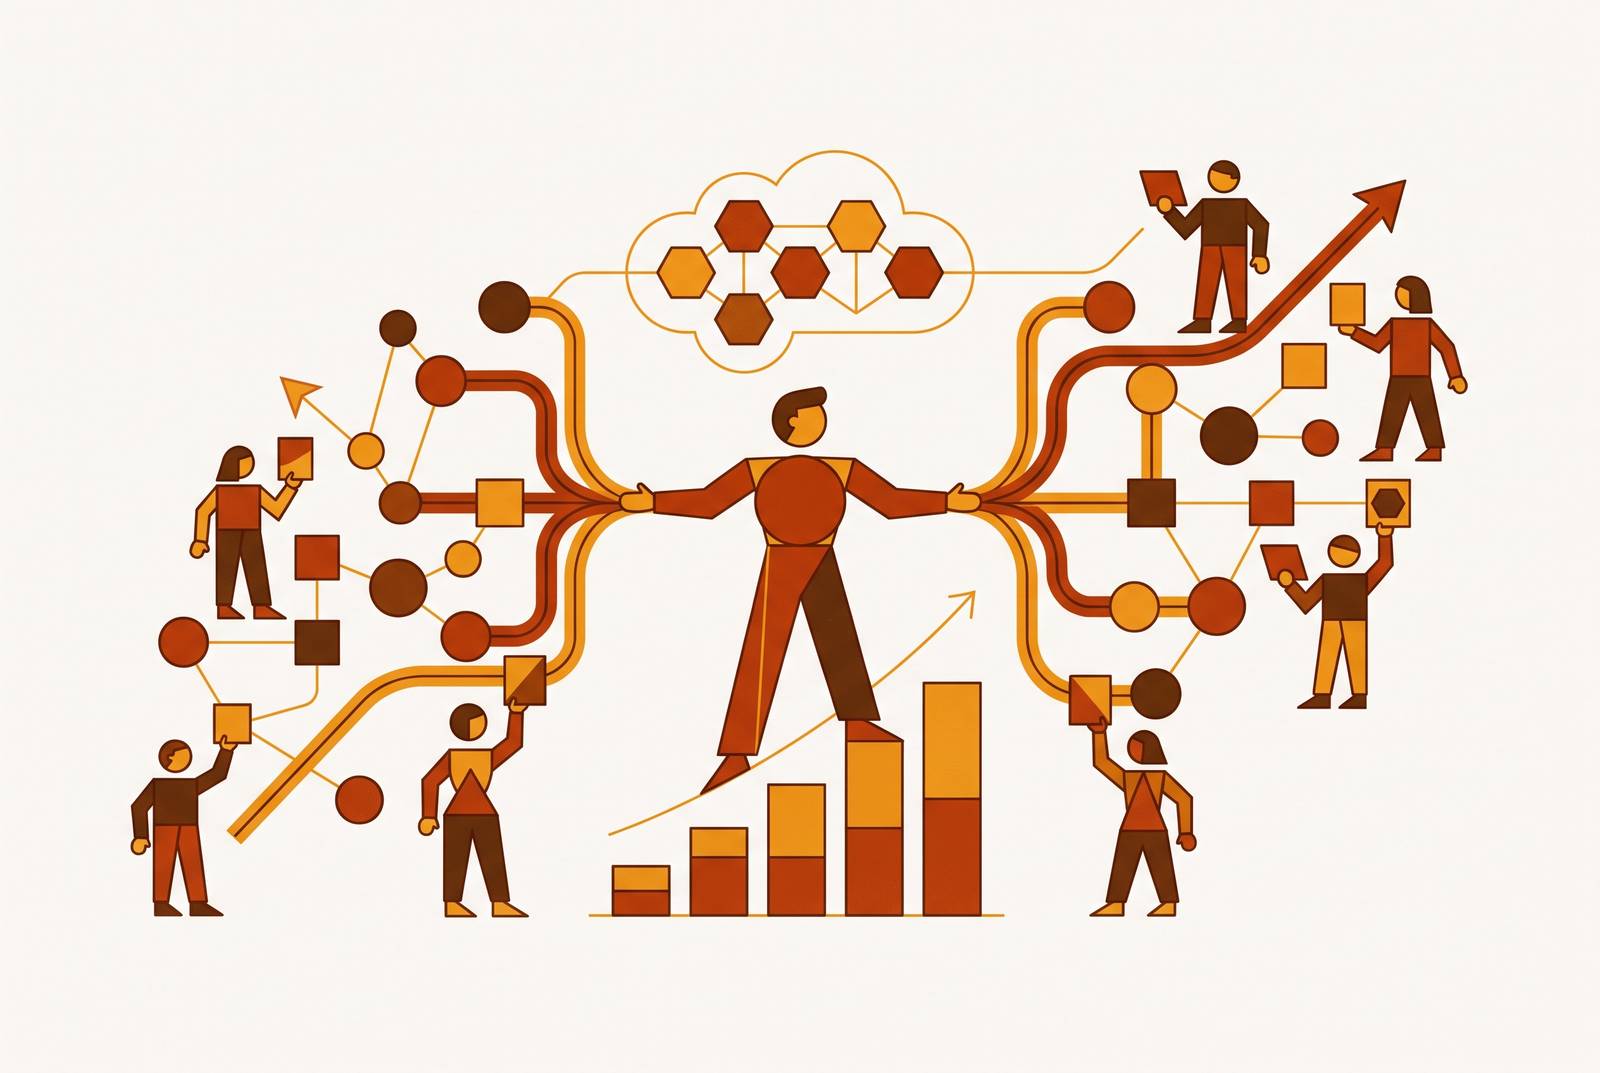
Data fluency is table stakes now. Every function is expected to read a dashboard, question a number, and make a call based on what the data actually says. Only 35% of organizations report having a mature, workforce-wide upskilling program, and the majority are running training that stops short of culture change https://www.datacamp.com/blog/the-state-of-data-and-ai-literacy-in-2026-definitions-statistics-and-the-ai-skills-gap. Most training stops at "here's how to read a chart," delivered once, and then never revisited as part of how people actually work.
The skills gap isn't a data science problem. Most functions don't need someone who can build a machine learning model. They need someone who can look at a number, trust it, and use it to make a decision without waiting for permission. That's a much smaller ask, and most organizations still aren't meeting it.
The top skills gaps named for 2026, data fluency, AI literacy, and cross-functional collaboration, are adjacent, reinforcing gaps rather than separate problems. A team that can't collaborate across functions usually can't agree on what a number means either. A team that struggles with AI literacy is usually the same team that never learned to question a spreadsheet in the first place.
So why does training keep failing to close the gap? The content is rarely the issue. Data fluency training generally covers the right ground: reading charts, understanding basic statistics, spotting a flawed comparison. What it can't touch is what happens the next morning. Does the team still have to file a ticket to get a number? Does the manager still answer every data question by forwarding it to someone else? Training can hand someone a skill. It can't hand them a workplace that lets them use it, and that gap is where nearly every fluency initiative actually dies.
Manager-controlled factors determining whether data fluency takes hold
Stripping away the culture-building language, the manager's role comes down to four concrete levers.
Access is the first: does the team have consistent, permissioned data access, or does every question require a ticket to someone else's queue? Workflow integration is the second: is looking at data baked into rituals the team already runs, like standups and retros, or treated as a separate, special activity? Psychological safety is the third: can someone ask a basic question about a number without it becoming a performance issue? Modeling is the fourth: does the manager use data out loud, in front of the team, or route every question straight to an analyst?
Modeling decides whether the other three ever matter, and most managers underrate it. A manager who forwards every data question is teaching the team, without saying a word, that data isn't really their job. It doesn't matter how good the training was. If the manager's own behavior says this isn't for you, the training doesn't stand a chance. Access and rituals set up the conditions. Modeling is what actually gets them used.
This isn't a theory about culture, it is visible in the return numbers. Organizations that pair AI or data investment with structured workforce capability building see 42% reporting significant AI ROI, nearly double the average https://www.datacamp.com/blog/the-state-of-data-and-ai-literacy-in-2026-definitions-statistics-and-the-ai-skills-gap. Buying the tool or running the training is the easy part. Building the daily conditions where people actually use what they learned is what moves that number, and that building is a manager's job.
Team structure and its role in whether managers can play this role
None of the four levers matter if the org chart works against them. Plenty of well-intentioned managers hit a wall they didn't build and can't fix alone, and the wall usually has a name: the centralized data team.
When every data request from every team funnels through one central group, response times stretch out and business units start finding workarounds. A manager can't build a daily habit of self-serve data use if self-serve actually means two people asking the same question and getting two different numbers, because no single definition was ever enforced.
A health-tech company's growth team lived this directly: it built its own shadow BigQuery pipeline because the official data team, sitting under finance, couldn't get forward-looking numbers out fast enough. That placement under finance wasn't incidental. Data functions that report into finance tend to drift toward backward-looking reports and compliance work. Data functions that report into the CTO tend to lean more technical, sharper on engineering but weaker on connecting to what the business actually needs answered. Neither placement is wrong on its face, but each pulls a team's output in a different direction, and a manager sitting outside that team has to live with whichever direction it pulled.
Call the shadow pipeline what it was: not a governance failure, but a manager-level workaround born of necessity, because the official channel couldn't move at the speed the business needed. Centralization looks efficient on an org chart and produces exactly this kind of end run in practice. Structures that embed analysts directly inside business units, instead of centralizing them, close that gap. When the person who can answer a question sits inside the team asking it, the distance between having a question and having an answer shrinks fast.
The cost of the engineering backlog problem for non-technical teams
Organizations spend heavily on data infrastructure and still can't get a straightforward answer out the other end fast enough. The queue in front of the infrastructure is the bottleneck. It's the queue in front of it.
On a 10-person data engineering team, routine pipeline requests create unproductive work equal to 3.75 full-time employees doing nothing but managing overflow https://www.prophecy.ai/guides/data-engineers-shouldnt-own-every-pipeline-ai-reduces-load. That's more than a third of the team, effectively, doing triage instead of building anything.
This is happening exactly as business teams demand faster turnaround, not slower. dbt Labs' State of Analytics Engineering Report found the share of teams prioritizing speed in data delivery rose from 50% to 71% year over year https://www.getdbt.com/resources/state-of-analytics-engineering-2026. Demand is climbing on one side of the pipe while capacity shrinks on the other, and that mismatch is what produces the shadow pipelines and workarounds already described above.
What does this cost the non-technical team specifically? Time, and trust. Every week a marketing or ops team waits on a report is a week they're either deciding blind or deciding on last quarter's numbers, because that's what happened to be sitting around. Neither is a good option, and neither is really their fault.
Requirements for self-serve analytics before non-technical teams can use it
Self-serve analytics sounds like the obvious fix. Give the team a tool, let them pull their own numbers, skip the queue. It doesn't work nearly as often as it should, and the reason is almost never the tool. Most self-serve failures are governance failures dressed up as tooling failures.
Two people on the same team ask the same question, pull two different numbers, and now there's a meeting about whose number is right instead of a meeting about what to do next. Nobody enforced a single definition of the metric. Access without agreement on definitions doesn't create fluency. It creates arguments.
The appetite for self-serve is close to universal, which makes the execution gap more striking, not less. In 2025, 53% of data professionals said they were unhappy with their current analytics product or actively considering a switch, and 70% called self-serve analytics a worthy goal while still reporting real roadblocks getting there https://hex.tech/blog/analytics-tools-non-technical-teams/. Everyone wants this. Almost nobody has cracked it cleanly.
Adding AI on top doesn't fix any of that. It makes the underlying problem louder. Ungoverned AI layered onto a self-serve tool makes existing data quality problems more visible instead of resolving them. An LLM that answers a question in plain English is only as reliable as the tables that feed it. Inconsistent definitions produce confusion, and AI just delivers that confusion faster, with more confidence attached.
That's likely why trust has overtaken speed as the top concern in the data world. dbt Labs' report shows the share of respondents prioritizing trust in data rose from 66% to 83% year over year, passing speed as the number one worry https://www.getdbt.com/resources/state-of-analytics-engineering-2026. Before a non-technical team can use a self-serve tool responsibly, someone has to have already done the unglamorous work of agreeing what each number means, everywhere it appears.
Evaluating BI and data access tools for a team without dedicated data staff
The market is enormous, and that size is why it's easy to buy the wrong thing. Global BI spend is projected to reach $37.96 billion in 2026, with cloud deployments making up more than half of it https://technovapartners.com/en/insights/best-business-intelligence-tools-2026. Bigger budgets and flashier AI features don't fix the problem this piece keeps circling back to. Governance does, and governance should be the first filter a team applies, not the last.
Four levers managers hold directly matter: someone without SQL knowledge can get safe, permissioned access to dashboards, editable data views, and saved queries without hand-holding, and the tool needs real governance controls, since most self-serve analytics failures happen because two people ask the same question and get two different numbers when no single definition was enforced.
Natural language query is turning into a baseline expectation, not a differentiator. Gartner's August 2025 forecast projects that 40% of enterprise applications will integrate task-specific AI agents by the end of 2026, up from under 5% in 2025 https://fuselabcreative.com/top-dashboard-design-trends-2025/. Asking a question in plain English is heading toward standard functionality, not premium.
The named platforms make the tradeoffs concrete. Power BI Pro runs $14 per user per month, with Premium Per User at $24 https://hex.tech/blog/analytics-tools-non-technical-teams/. Its Copilot feature can generate query logic and answer questions through a Q&A visual, but the quality of those answers depends entirely on how well the semantic model it draws on was built. A messy foundation still produces messy answers, AI layer or not.
Tableau Pulse pushes proactive, AI-generated metric summaries out through Slack, email, or Microsoft Teams, a genuinely useful addition. That comes at a real premium: Creator licenses start around $70 or more per user per month, roughly $7,000 a month at 100 users. That's a serious line item for a team without a dedicated data budget, and visualization depth is rarely the actual bottleneck worth paying that much to solve.
Natural-language-search tools let someone type a question in plain English and get an answer pulled from live data, which lowers the bar for anyone intimidated by dashboards and filters. But the learning curve dropping doesn't make governance concerns disappear just because the interface got friendlier.
A different category of tool sits directly on top of a production database, Postgres, MySQL, and similar systems, and offers dashboards, editable data views, and saved queries without requiring a company to stand up a full separate BI stack. That fits engineering-administered environments where the real goal is safe, permissioned access for teams that don't know SQL. For a 100-person company without a dedicated data team, this is usually the more proportionate answer than an enterprise BI rollout.
Looker sits at the opposite end. It's developer-first, using a LookML semantic layer to enforce governed metric definitions, and it carries the steepest learning curve of the group. That's the right tool for an organization that has already solved its governance problem. It's the wrong first purchase for one that hasn't, and buying it first is how teams end up with expensive dashboards nobody outside engineering can touch.
Data-fluent management in practice: workflows, habits, and team rituals
None of the tooling matters much if the daily habits around it don't exist. What does a genuinely data-fluent team do differently, day to day?
A few rituals recur. Weekly or biweekly metric reviews, where the manager asks what does the data say before anyone draws a conclusion, out loud, in front of the team, model the exact behavior that spreads through the rest of the team. Retrospectives that include a data question, what did the team expect, what actually happened, what the gap means for next week, turn analysis into a normal part of looking back instead of a special report someone commissions. Planning cycles that start from a dashboard or a live query, instead of someone's memory of how last quarter went, keep decisions anchored to something checkable. Pairing, where a more fluent team member walks someone else through a query as part of real work rather than a formal training session, teaches the skill in the exact context it'll get used again.
None of it works if access is still the bottleneck. A team can't build a daily habit around data if every question still means filing a ticket and waiting. Removing that friction is a manager's job, and it has to happen before anyone can reasonably ask the team to self-serve.
The real dividing line: a dependent team knows how to read a report someone else built for them. A fluent team can form a hypothesis, go check it themselves, and come back with an answer nobody had to build for them in advance. That's the actual finish line, and it has very little to do with how good the training slides were.
The internal case managers make for the access and tooling their team needs
A manager is rarely the person who buys the BI tool or redraws the data team's org chart. Conviction alone doesn't get anyone access. The case has to be made, and made differently depending on who's sitting across the table.
For engineering or data leadership, the framing is compounding cost. Every data question routed through the central data team instead of answered directly by the requesting team eats engineering time that adds up fast at scale. With 55% of development teams already losing 5 to 15 hours a week to this kind of drag, a real slice of that time goes to answering questions a better-tooled, more fluent business team could have handled on its own https://www.prophecy.ai/guides/data-engineers-shouldnt-own-every-pipeline-ai-reduces-load. The ask is governed, permissioned access, specifically so the team stops generating tickets for routine questions.
For finance or operations leadership, the framing shifts to risk and waste. Low fluency doesn't just slow decisions down. It produces multiple versions of the same number floating around different teams, and real political cost when two people trace their disagreement back to asking the same question and getting two different answers, because nobody enforced a single definition.
The ROI case doesn't have to be hand-wavy either. Organizations that pair investment with structured workforce capability building see 42% reporting significant AI ROI, nearly double the average https://www.datacamp.com/blog/the-state-of-data-and-ai-literacy-in-2026-definitions-statistics-and-the-ai-skills-gap. That number draws a straight line between tooling paired with manager-led fluency building and an investment that actually pays off, versus one that mostly doesn't. Ambiguous data ownership is already cited by 41% of respondents as an ongoing challenge, which is exactly the failure mode this argument is built to prevent https://www.getdbt.com/resources/state-of-analytics-engineering-2026. The case for access is a cost argument, and the numbers to make it are already sitting inside most organizations' own data. In a survey of 500+ US and UK enterprise leaders, expectations around data literacy and organizational readiness were assessed https://www.datacamp.com/blog/the-data-literacy-skills-gap-in-enterprise-why-table-stakes-still-aren-t-universal. Unproductive work costs every team the equivalent of 1–3 full-time engineers, representing 5–15 hours per developer per week https://www.prophecy.ai/guides/data-engineers-shouldnt-own-every-pipeline-ai-reduces-load. Engineers spend 30% of their time maintaining internal software that nobody outside the company will ever see https://www.basedash.com/blog/internal-tools-in-2026-admin-panels-ops-dashboards-and-back-office-automation. 42% of data teams report into CTO/Engineering https://www.integrate.io/blog/july-2025-trends-report-how-data-teams-are-structured/. 35% of data teams added new roles https://www.integrate.io/blog/july-2025-trends-report-how-data-teams-are-structured/. According to McKinsey research, only 1% of employers feel ready for the effects of AI adoption https://about.udemy.com/press-releases/2026-global-learning-skills-trends-report/.