Data Literacy Gaps by Department in Mid-Size Companies
Sales, marketing, and ops each struggle with different data skills their tools can't teach.

Data literacy gaps in mid-size companies don't look the same everywhere. Sales struggles with one thing, marketing with another, and support and product and ops each have their own version of "we have the data but not the skill (or the access) to use it." Per DataCamp's survey of 500+ enterprise leaders, 88% say basic data literacy matters for day-to-day work, but 60% say their organization has a skills gap anyway. Gartner puts a number on what that gap costs: nearly $15 million a year in losses tied to bad data, and almost 60% of businesses aren't even tracking that cost. So the problem is expensive and mostly invisible at the same time.
This piece looks at mid-size companies specifically, roughly the 50 to 200 person range, because that's where the gap bites hardest. Big companies have dedicated analysts embedded in every department. Mid-size companies usually don't. A generalist in sales, or support, or ops, pulls a number, and there's no one standing behind them to sanity-check it before it turns into a decision.
What "data literate" means for a non-technical employee
Data literacy is not data science. Nobody's asking a customer support rep to build a regression model. It means something more basic: can you read a dashboard and know if it's telling the truth? Can you tell the difference between two things happening at the same time (correlation) and one thing causing the other (causation)? Can you turn a number into an actual decision?
Per DataCamp's survey, the breakdown leaders describe most often isn't "people can't make reports." It's "people can't tell what the report means, or how much to trust it." That's a different problem, and it's the one that actually matters.
Five things make up real data literacy on the job:
- Knowing what data exists and where to find it
- Checking data quality before trusting it
- Reading a chart or dashboard with a critical eye, not just a glance
- Connecting a number to the actual business question (the "so what")
- Explaining a finding to someone who wasn't in the room when you found it
Literacy is not the same as knowing how to click through a tool. Someone can pull a slick report out of a BI platform and still have no idea whether the underlying numbers are any good. That's tool proficiency wearing literacy's clothes.
Why does this matter more in a mid-size company than a large one? Because there's no analyst buffer. When a salesperson or an ops manager pulls a number, they are very often the only human who looks at it before it shapes what happens next. No second set of eyes. No safety net.
The structural reason gaps cluster by department
Why don't these gaps look the same everywhere? Start with the tools. Sales lives in Salesforce. Marketing lives in HubSpot. Finance lives in spreadsheets. Per Databox research, this fragmentation means there's no shared data reality across departments, and without a shared reality, there's no common language for being "literate" in it.
That fragmentation has a real cost. Per Databox, 64.29% of teams say it takes one to three days just to answer a basic business question. That delay isn't only a skills problem. It's a plumbing problem: the pipes between departments don't connect, so someone has to manually stitch the picture together, and every manual stitch is a chance to get it wrong.
Cross-functional questions, the ones that need data from two systems at once, almost never get answered cleanly. And each department's gap is shaped by what it's actually supposed to decide with data. A support team misreading a ticket trend is a different failure than a sales team misreading a pipeline forecast. Same root problem (data literacy), completely different symptoms.
One more structural wrinkle specific to mid-size companies: there's usually a single central data or engineering team serving every department. Each department's gap doesn't just sit there. It drains that one shared resource, because every unresolved question becomes another ticket in that team's queue.
What follows are profiles of five departments. Think of them less as report cards and more as maps: here's where the bottleneck sits, and here's what's causing it.
Sales: the gap between CRM data and pipeline judgment
Sales teams sit on more data than almost any other non-technical function. Activity logs, deal stage history, win/loss records, pipeline velocity, it's all there in the CRM. And yet confidence in reading that data in aggregate is often the lowest of any department.
Reps and managers can read their own deals just fine. That gap appears when they need to reason across the whole pipeline: which deal characteristics actually predict a close, whether a conversion dip is a real trend or seasonal noise, where the pipeline is quietly rotting. That's a different skill than knowing your own accounts.
A second gap sits right next to it: leaning on one number, usually revenue or close rate, and ignoring the leading indicators that would let someone intervene earlier. By the time revenue moves, it's already too late to fix whatever caused it.
Forecasting brings its own version of the problem. Good forecasting means separating what the data actually says from what a rep hopes it says. That's a confidence and judgment skill. No tool teaches that.
And here's a specific friction point for mid-size companies: sales leadership often wants to combine CRM data with product usage data, or support ticket volume, to get a real read on customer health. Doing that requires either an engineer or a painful manual export. Neither happens reliably, so the combined view rarely gets built at all.
Connect this back to the cost. Per DataCamp's survey, 39% of leaders name inaccurate decision-making and 37% name slow decision-making as top risks from weak data skills. A misjudged pipeline is both of those risks happening in the same place at the same time.
Marketing: the metric proliferation problem
Marketing has the opposite problem from most departments: too much dashboard, not too little. Ad platforms, web analytics, email tools, CRM attribution, all generating numbers constantly. The gap isn't generating data. It's weighing one number against another and knowing which one to trust.
Take attribution. Last-click attribution can make one channel look like the hero of the funnel when it's really just catching credit that belongs somewhere earlier in the journey. A literate team knows to be suspicious of that. A less literate team just reports the number.
It gets messier because tools don't even agree on what a word means. A "conversion" in an ad platform is not the same event as a "deal created" in a CRM. Without a shared definition, marketing and sales end up arguing about the same funnel using different math, and neither side is technically wrong.
When a team doesn't trust its own analysis, it tends to retreat toward metrics that are easy to move and easy to report: impressions, follower counts, open rates. Easy to report is not the same as meaningful. That's the vanity metric trap, and it's a coping mechanism as much as a mistake.
AI adds a new wrinkle here. Per DataCamp's survey, 82% of teams use AI at least weekly. AI tools are good at producing something that looks like a professional chart. The risk isn't an obvious error, it's a plausible-looking one: a chart with hallucinated numbers, formatted well enough that nobody questions it.
What does a more literate marketing team actually do differently? It agrees on one source of truth for funnel numbers. It treats attribution models with healthy skepticism instead of blind faith. And when it reports to leadership, it says "here's what we're not sure about" instead of faking precision it doesn't have.
Customer support: reading ticket data beyond volume counts
Support teams generate plenty of data: ticket volume, resolution time, CSAT scores, issue categories. That gap almost always appears in the same place, interpreting trends and getting that interpretation to the people who could act on it.
Most support teams can tell you if volume went up or down this week. Fewer can tell you why. Which product area is driving the spike? Is it a one-time blip or the start of a pattern? Is one customer segment disproportionately affected? Those questions get asked far less often than how much volume changed.
There's a structural piece to this too. Support insight rarely reaches product or engineering as a number. It reaches them as a sentence: "customers keep complaining about X." Narrative doesn't compete well against a roadmap full of quantified priorities, so it tends to lose.
CSAT has its own trap. A stable average score feels reassuring, but averages hide things. A shrinking subset of customers can be getting a much worse experience while the overall number holds steady. Literacy here means segmenting the score.
Access compounds the problem. Support teams are often not given a window into product usage data or release history. So when tickets spike right after a release, connecting those two facts requires engineering's help, and that help rarely arrives fast enough to matter.
Closing this gap pays off more than most. The insight is already sitting in the ticket data. What's missing is access and the confidence to dig, not some rare technical skill.
Product: the gap between instrumentation and insight
Product managers are usually expected to be the most data-fluent people in the building who aren't engineers. In a mid-size company, they're also often the ones deciding what gets measured in the first place, then interpreting it, then translating it into a roadmap.
That's a lot of jobs stacked on one role. The instrumentation gap appears when a team tracks plenty of events but struggles with the harder questions: is this movement statistically meaningful or just noise? Did the feature change cause this metric to move, or did something else happen at the same time?
A case study from a Series B SaaS company (via sranalytics.io) makes the point well. A team built out an extensive product usage dashboard. When they actually watched how customer success used it, the team only ever looked at three metrics: a small set of decision-critical metrics. Once the dashboard got rebuilt around just those, adoption jumped from 18% to 71%.
That's not a tooling failure. Nobody needed a better chart-building tool. It's a judgment failure, building around what's measurable instead of what decisions people actually need to make.
There's a second gap sitting next to the first: PMs often have the numbers but not the framing to make those numbers land with engineering or leadership. Having the data and communicating the data are two different skills, and only one of them gets taught.
Put it together and mid-size companies are asking one role to design the measurement, interpret the results, and communicate the conclusion, without a dedicated analyst backing any of those three steps. That's a heavier statistical lift than most product hires were ever trained for.
Operations: the gap between reports and process decisions
Operations teams are often good at reporting. They know their numbers cold. The gap appears in a less obvious place: using data to tell whether a process change actually worked, and designing the measurement before making the change, not after.
The common failure looks like this: ops rolls out a new process, then checks the same metrics that were already being tracked, rather than metrics built specifically to catch the effect of that one change. Without that specific measurement, there's no way to isolate cause. Something moved, but nobody can say why.
Systems fragmentation makes this worse. Inventory data, logistics data, finance data, headcount data, often none of it talks to the others. Answering a cross-system question means manual assembly or an engineering favor, and neither one is fast.
That drag causes lost productivity. Per DataCamp's survey, 23% of leaders cite decreased productivity as a top risk of weak data skills. In ops, that often looks like a meeting spent arguing about what the data says instead of a meeting spent deciding what to do about it.
There's a specific mid-size wrinkle here too: ops leaders in smaller companies are frequently the ones standing up brand-new tools and processes with no analyst in the room. That means they need to be literate enough to ask the right measurement question before the rollout starts, because there's no one coming along afterward to fix the measurement in hindsight.
Why training programs haven't fixed these gaps
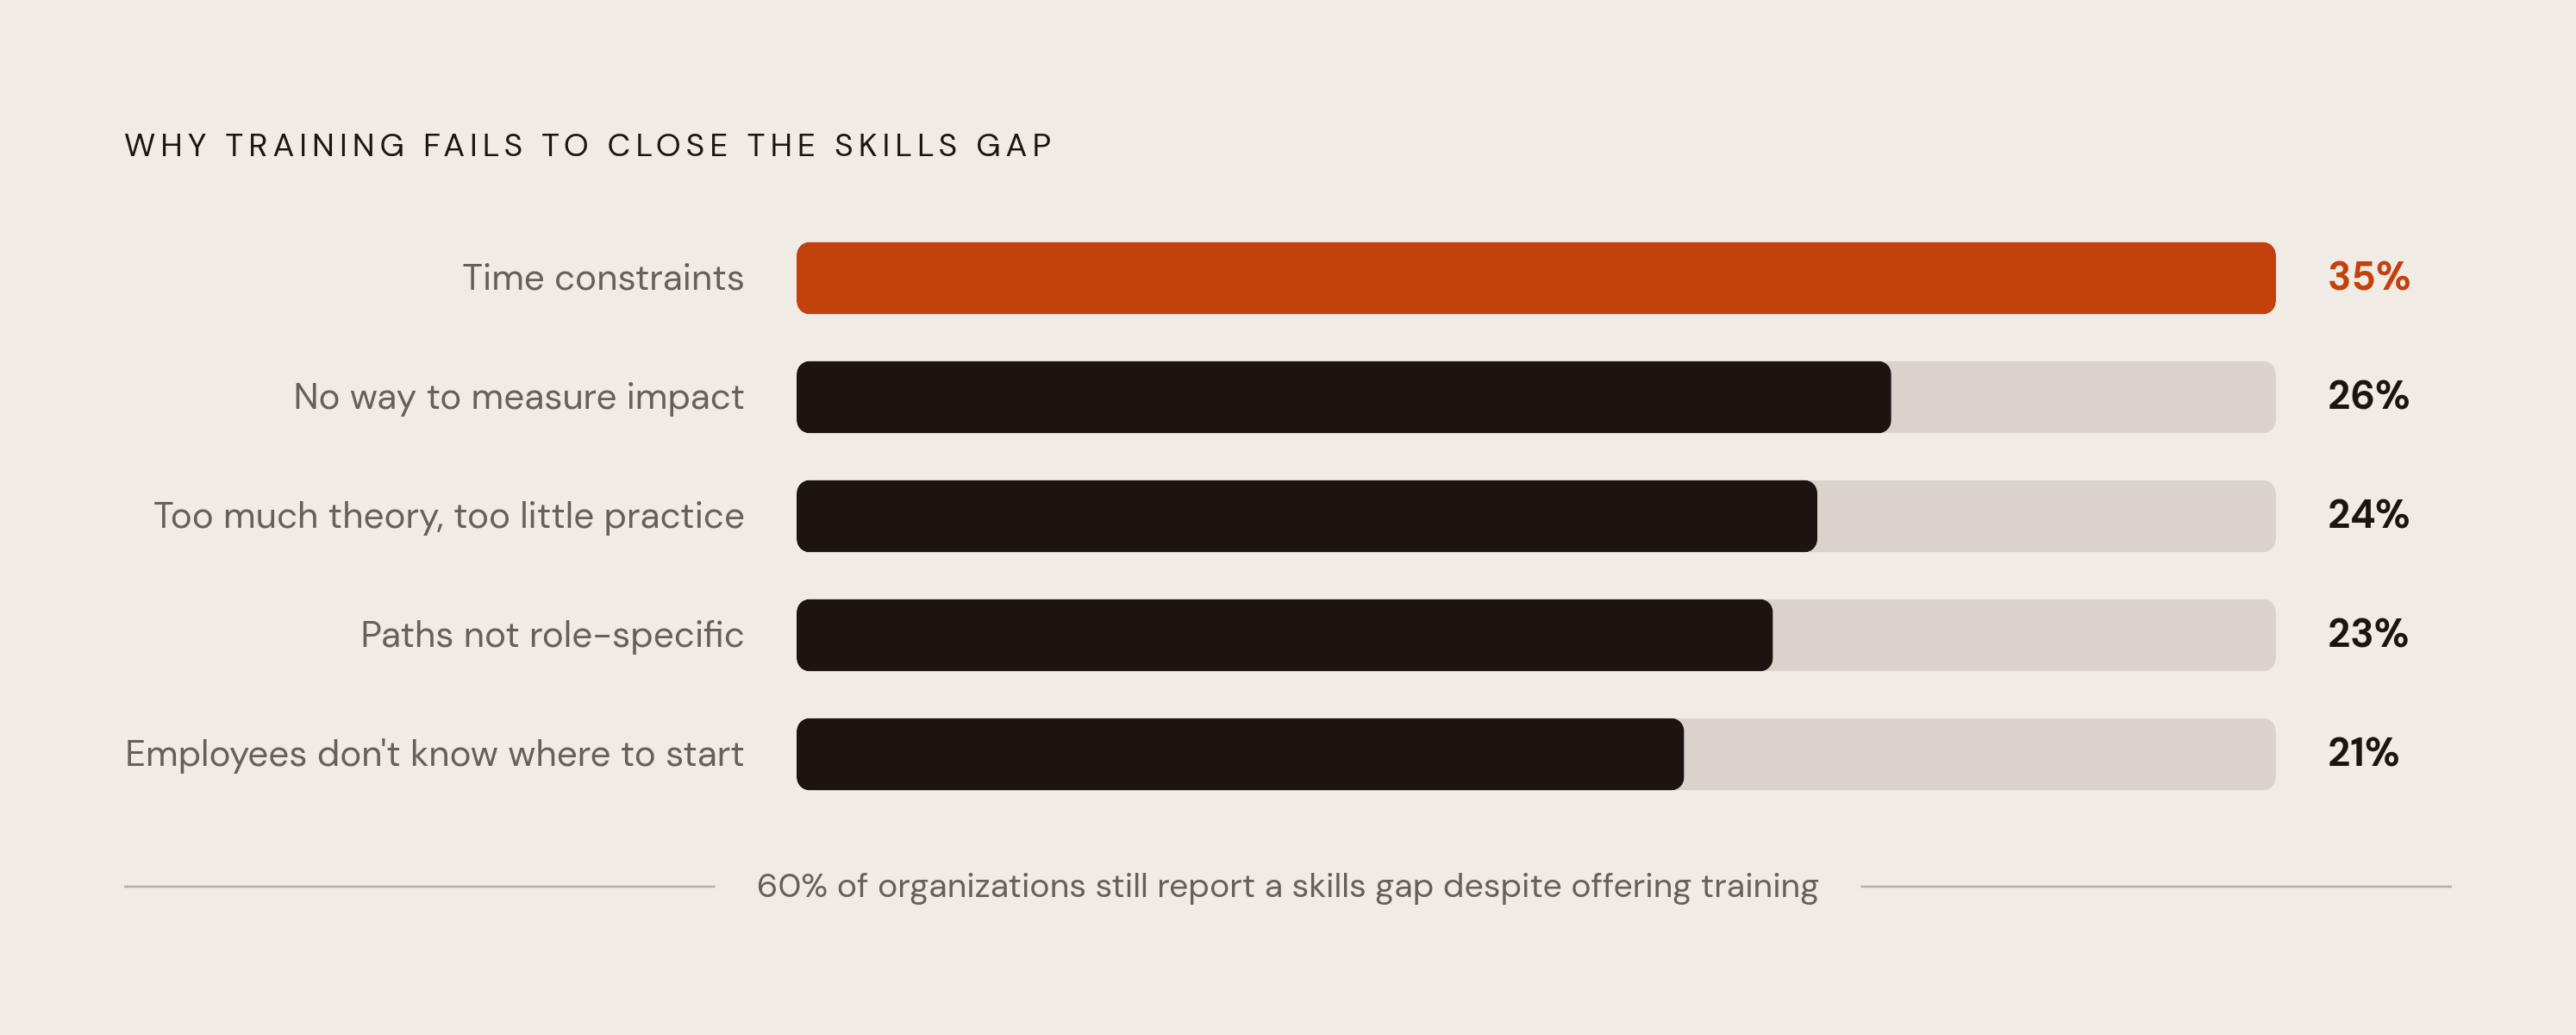
Any company should pause at this part. Per DataCamp's survey, a majority of leaders say employees have access to data learning resources. Most say they offer some form of data training. And still, 60% report a data skills gap. So training is happening, at scale, and the gap isn't closing. Why?
A few structural problems recur again and again in the same DataCamp 2026 data:
- Learning paths aren't tailored to specific roles (23% of leaders cite this)
- Not enough hands-on practice, too much theory (24%)
- No good way to measure whether the training actually worked (26%)
- Employees don't know where to even start (21%)
Time causes all of that, since 35% of leaders cite time constraints as the single biggest barrier to improving data skills. 35% of leaders cite time constraints as the single biggest barrier to improving data skills. Generic training is competing against actual work for actual hours, and actual work usually wins.
There's a more hopeful data point buried in this too. Per AIR National Survey data, institutions that offer data literacy training report employee capability ratings nearly double those that don't. So training isn't worthless. But even where it exists, many leaders still rate their own organization's data literacy as "Not Occurring" or "Reactive." The training exists; it's just misaligned, too infrequent, or disconnected from the moment someone actually needs to make a decision.
One might argue the real problem is culture, not curriculum. Training raises awareness. Culture decides whether anyone acts on it. Drawing on both the AIR National Survey and Jordan Morrow's "Be Data Literate," the pattern is consistent: when leaders don't visibly use data to make their own calls, employees pick up on that fast, and the skills from training quietly stop getting used.
Which leads to the real implication: a marketing team's confusion about attribution models has almost nothing in common with a support team's struggle to read ticket trends. Solving both with the same company-wide course was never going to work.
What closes departmental gaps: access, not just ability
What if the gap isn't really about ability at all? Look closely at a lot of these department profiles and a pattern is visible: people with decent instincts can't get to the data they need without filing a ticket and waiting. That's not an ability problem. That's an access problem.
Every BI vendor sells the promise of self-serve analytics, "no-code, anyone can do it." In practice, "no-code" still tends to require understanding joins, schemas, and how a metric is defined under the hood. That hidden layer of knowledge quietly excludes the exact non-technical users the tool was supposed to help.
A governance problem, not an access problem, causes most of these self-serve breakdowns. In practice, two people can ask the exact same question and walk away with two different numbers, because nobody ever locked down what the metric actually means. That's not a training failure. That's a definition failure.
What actually moves the needle at the access layer:
- Metric definitions enforced in the data model itself
AI-assisted querying lowers the barrier even further, letting someone type a question in plain language instead of writing a query. But it carries the same risk marketing already ran into: these tools predict what sounds right, not what is actually correct, and they can produce a chart full of numbers that were never real. The fix isn't avoiding the tool. It's enforcing governance at the data layer itself, so a wrong answer can't sneak through looking legitimate.
There's a payoff for the data team too. When departments can serve their own questions, the central data team stops fielding the same repetitive report request for the hundredth time and gets its hours back for harder problems. The investment in access pays off in more than one place at once.
And the payoff is measurable. Per DataCamp's survey, when data literacy is strong, 54% of leaders report faster decision-making and 49% report more accurate decisions, a measurable payoff. That's not an abstract cultural win. It's a concrete one, and it starts by removing the access bottleneck before worrying about anything else.
A practical starting point for closing gaps department by department
None of this calls for a company-wide literacy initiative kicked off with a slide deck and forgotten by next quarter. It calls for something narrower and more useful: pick one department, map the specific decision it struggles to make well, and ask two questions. Can the people making that decision get to the data they need without a ticket? And do they trust the number once they have it?
Sales needs help reasoning across the whole pipeline. Marketing needs one agreed-upon definition of its funnel, not seventeen dashboards fighting each other. Support needs a way to segment its own ticket data instead of watching one soothing average. Product needs fewer charts and more clarity about which three numbers actually drive a decision. Ops needs measurement designed before the rollout, not bolted on after.
Different departments, different decisions, different fixes. That's the whole argument. A gap that appears as low confidence in one department appears as no access in another, and no training course fixes both. Start by figuring out which one is actually broken where.
Sources
- What the Data Literacy Skills Gap is Costing Your Business
- Data Literacy Skills Gap in Enterprise: 2026 Insights | DataCamp
- Data & AI Literacy in 2026: Stats and Skills Gap | DataCamp
- Closing the Data Literacy Culture Gap
- Introducing the State of Data & AI Literacy Report 2025 | DataCamp
- 7 Data Literacy Gaps (and Practical Strategies for Building Data Confidence Across Your Team) | Databox