Data Fluency Onboarding for New Hires in Non-Technical Roles
Early data habits stick better than year-two training ever will.

The highest-leverage moment to build data habits
Most companies treat data training as a year-two problem. Most companies treat data training as a year-two problem, but the habits that matter most form in the first months, so pushing training to year two misses the window when it would do the most good.
DataCamp's State of Data and AI Literacy report found 60% of enterprise leaders say their workforce has a data skills gap, while 88% say basic data literacy is essential to doing the job well. Almost everyone agrees the skill matters, and most are still short-staffed on it anyway. That gap has nothing to do with hiring. Companies hire plenty of smart people. Nobody builds the system for turning "smart" into "data-capable" before bad habits set in, and that's the actual failure.
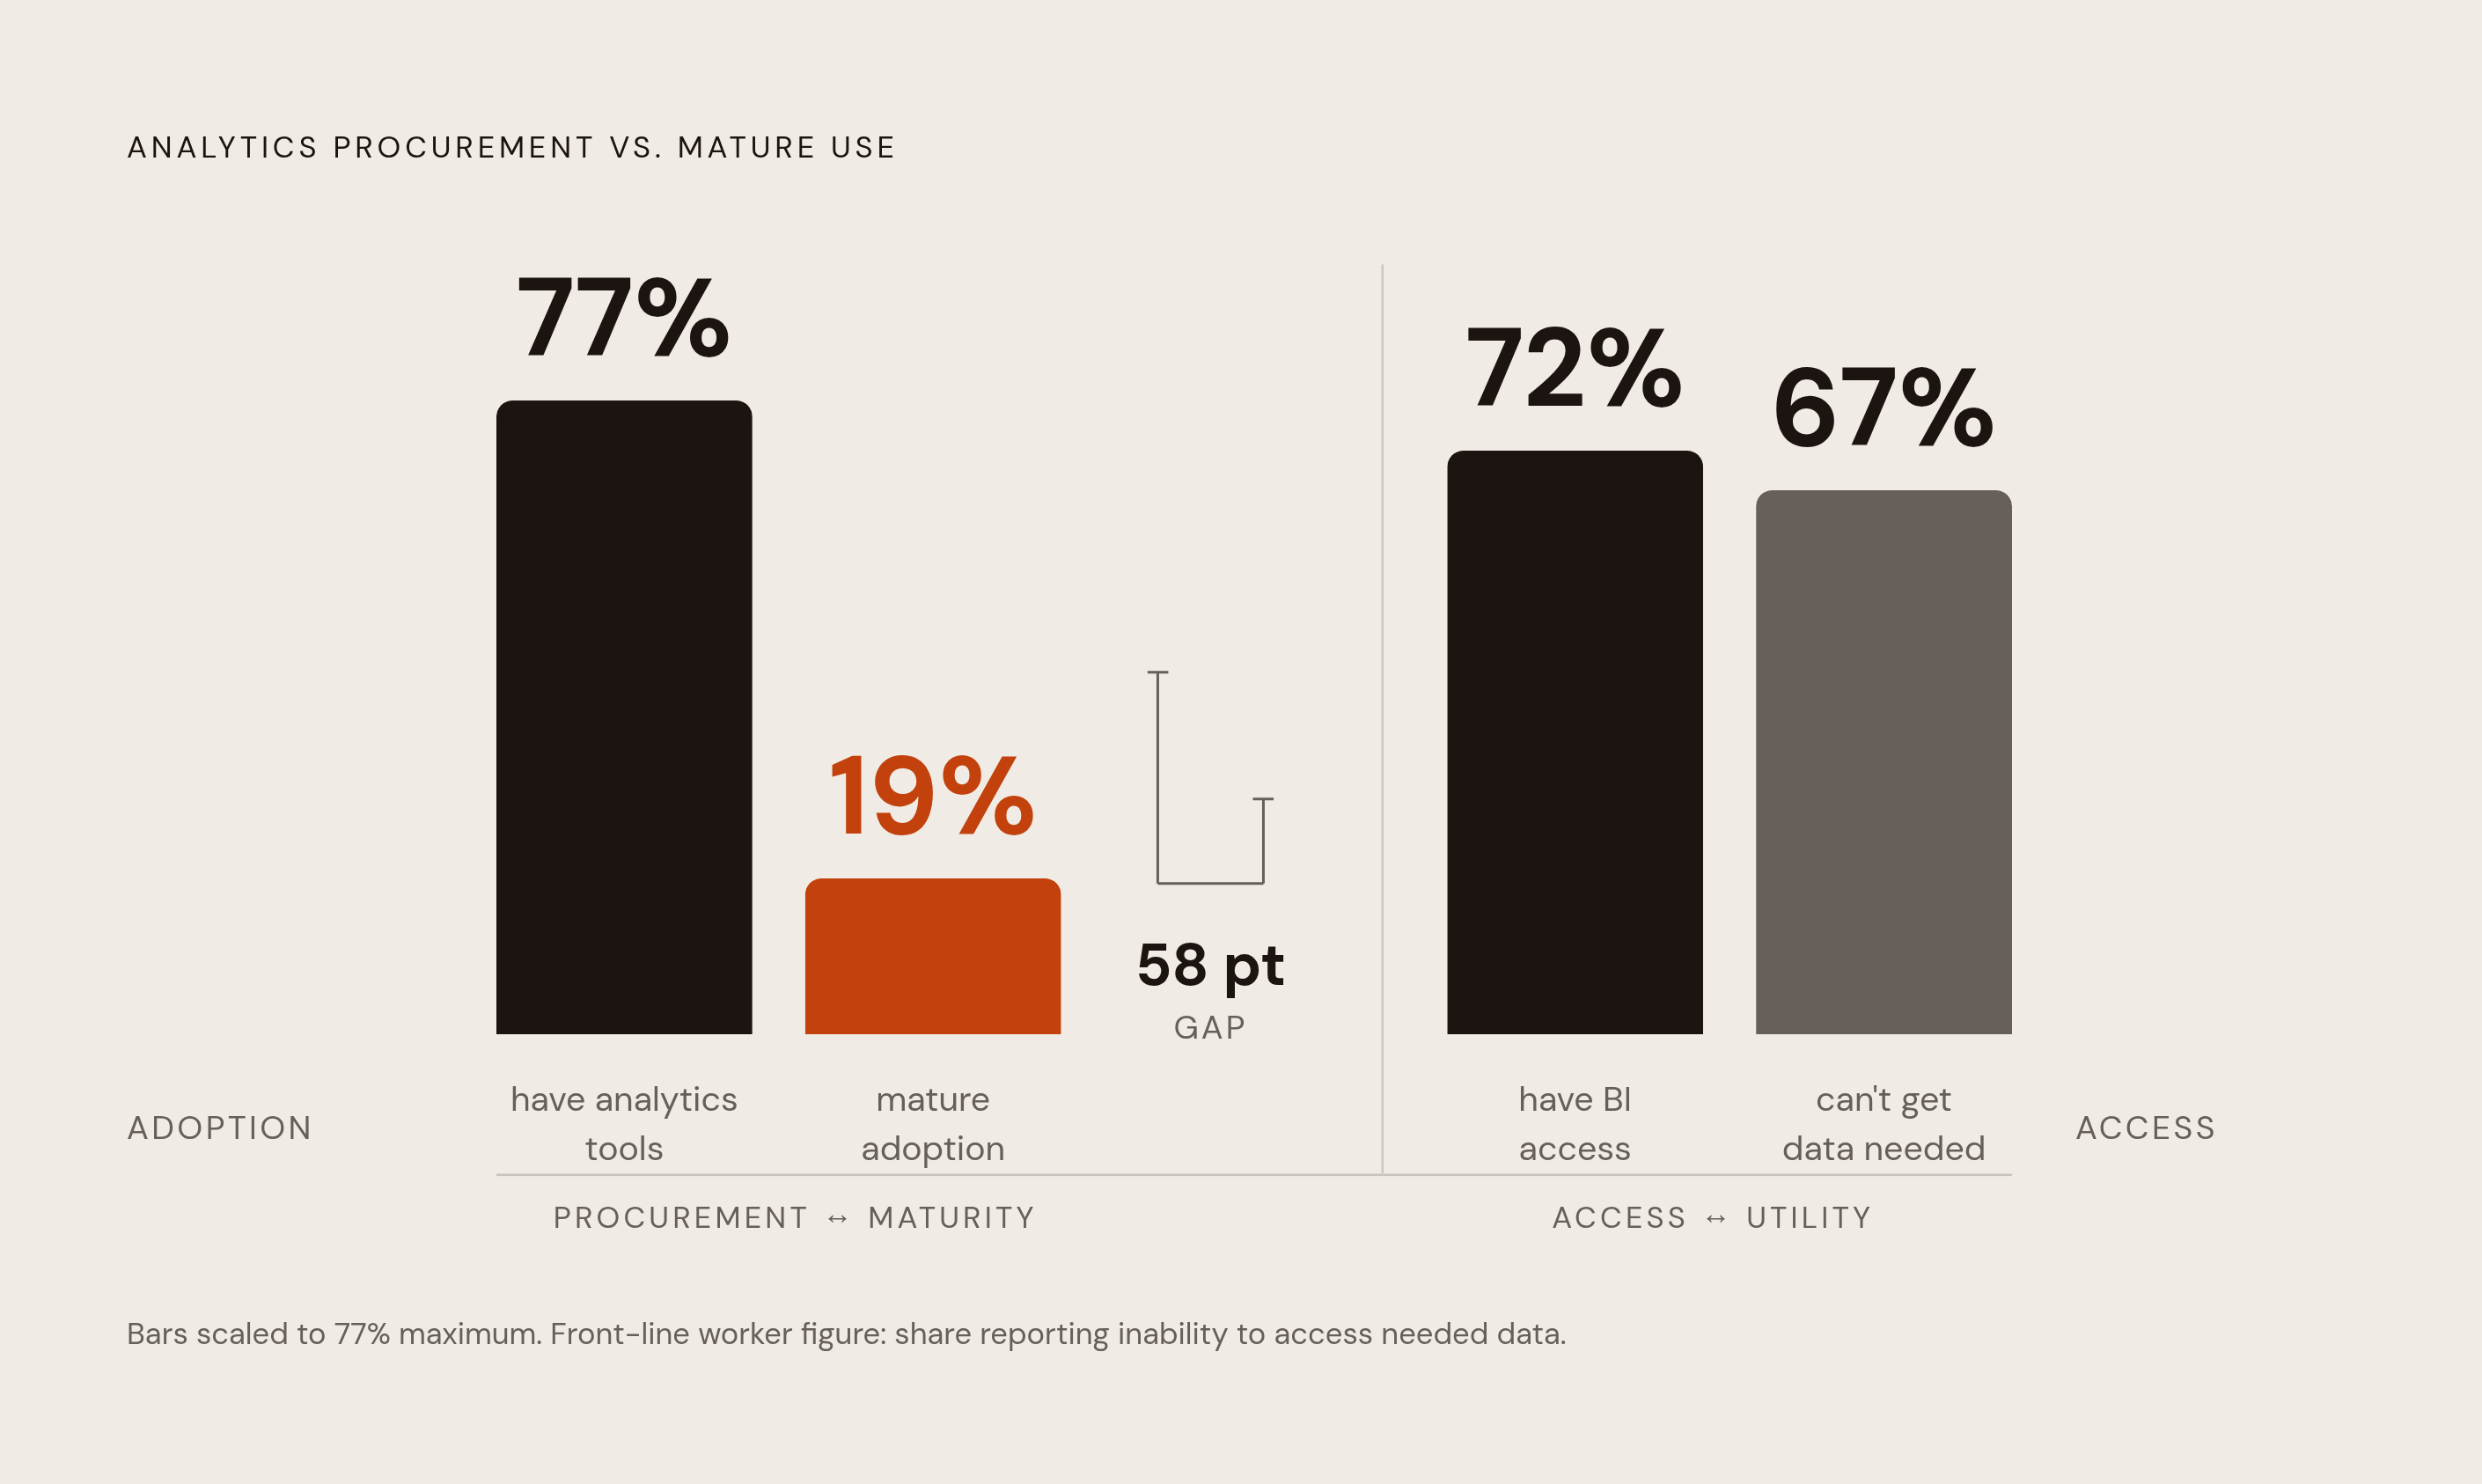
The EDM Association's 2026 benchmark shows the shape of it: 77% of organizations already have analytics tools in place, but only 19% show mature adoption. A 60-point gap between buying the tool and anyone using it. Somewhere between procurement and daily work, the tool gets shelved, and people go back to what they know: Slack threads, spreadsheet requests, gut calls.
Product managers, ops leads, marketers, support staff, most of them get hired with zero data expectations in the job description. Six months in, someone asks them to "just check the dashboard," and they have no idea where to click. The same request lands in the data team's inbox three times because nobody remembers who asked last time. A well-built report sits unopened because nobody was ever taught how to read it.
Onboarding is the only window that matters here because habits form early and the window to shape them shrinks fast. McKinsey's HR Monitor found only 46% of new hires are still with their employer after six months. Less than half. Whatever habits a company wants a new hire to build, there's a shrinking window to build them in. Once someone learns "email the analyst" as their first move, that's the habit. A self-serve dashboard introduced eight months later competes with a routine that already works well enough, not a blank slate. It's competing with a routine that already works well enough, and people don't trade a working routine for an unfamiliar one without a real reason to.
Running that same math forward turns into an argument for investing early. TechClass's analysis found companies with strong onboarding improve new-hire retention by as much as 82% and productivity by more than 70%. Clickboarding data (via HRCloud) shows employees who go through structured onboarding are 58% more likely to stay three years. Gallup's research, also via HRCloud, puts structured-onboarding employees at 2.6 times more likely to report being "extremely satisfied" at work. Putting those together shows onboarding as the highest-return moment in the entire employment relationship, and most companies leave the return on the table. It's the highest-return moment in the entire employment relationship, and most companies leave the return on the table: Research consistently finds that most employees do not think their company is actually good at onboarding. The bar is low. It's just unclaimed.
Data fluency onboarding should be built into the "real" onboarding, not stacked next to it as a bolt-on program. It's an outcome a well-built onboarding program already owes, the same way "knows how to submit an expense report" is.
What data fluency means for a non-technical new hire
The term "data fluency" gets used loosely enough to mean almost nothing, so it needs pinning down before building anything on top of it.
The workforce splits into two tracks that should never collapse into one training plan. Digital Workshop Center's framework draws the line clearly:
- Analysts and technical staff: building reports, writing queries, constructing dashboards from scratch.
- Non-technical hires in product, sales, marketing, ops, and support: reading data, interpreting findings, and making decisions based on what they see.
Most onboarding failures happen when a company teaches the second group with material built for the first. For non-technical hires, data fluency has nothing to do with SQL. It means knowing what data exists and where to find it, reading a chart without help, and telling a real signal apart from noise.
Leading workforce research consistently names capabilities like problem-solving, data analytics, communication, tech literacy, and critical thinking among the most important skills organizations need going forward. No SQL. No programming language. All five apply directly to non-technical roles, which is the whole point.
The payoff appears in speed and accuracy, not just comfort. DataCamp's framework found organizations with data-literate workforces report 54% faster decision-making and 49% better decision accuracy. That's a business getting faster and more right on things that used to take longer and get missed.
Tool orientation alone will not get a company there, even though it's tempting to think it will. Show people the dashboard, walk through the buttons, done. But a tool tour teaches features, not reasoning, and fluency runs on reasoning. Watching a video on data definitions doesn't teach someone how to spot a suspicious number, any more than watching someone drive teaches you to parallel park.
Onboarding programs need behavioral outcomes, not content checklists. "Completed BI tool orientation" says nothing about what a new hire can actually do. "Can independently answer a specific business question using the dashboard" says everything.
The phased onboarding roadmap: week-by-week data exposure that sticks
The roadmap comes down to sequencing: what gets introduced when, so each layer sits on top of the last instead of landing all at once in week one.
Preboarding, before day one
Send a short data landscape document before the new hire even shows up: what data exists, who uses it and why, which tool unlocks it. Preboarding has become increasingly common, with a growing share of employees receiving some form of it before day one. Using that window for data context, instead of just paperwork, cuts down first-week overwhelm. The new hire should arrive already knowing data is part of the job, not get surprised by it in week three.
Week one: orientation to data as infrastructure
Skip the generic tool demo. Introduce the dashboard inside the actual role. Pick three or four metrics the new hire will get asked about in their first month, and walk through how each one is defined, where the numbers come from, and what a normal range looks like.
Assign a data buddy, someone on the team who answers "where do I find X" questions in real time, no ticket queue in between. Cover permissions honestly too: what they can see, what they can't, and why. That last part builds trust in the system instead of suspicion of it.
Weeks two through four: applied practice in the job context
Move from watching to doing. Hand over a real question, not a made-up exercise, so the new hire has to find the answer in the tool itself. Pair that with regular manager check-ins built around three prompts: what did you find, what surprised you, what don't you understand yet.
This is the point to introduce metric definitions and governance, specifically why two people can pull two different numbers from the same system, and how the organization resolves that. Tying onboarding to role-specific milestones reflects the broader HR push toward personalized, skills-based development programs.
Month two through three: building independent judgment
By now the new hire should pick the right dashboard for a question without being told which one to open. They should tell a data problem (the number's wrong) apart from a business problem (the number's right, and it's bad news). They should start volunteering observations unprompted: "noticed X in the numbers this week."
Widen the lens here. How does their team's metrics connect to what other departments track? A marketing lead who understands how their numbers feed sales forecasting makes better calls than one who sees marketing data in isolation.
Delivery format matters as much as sequencing
Learning design principles consistently show that hybrid delivery, digital modules for definitions and concepts paired with live sessions for interpretation and discussion, outperforms either format alone. Definitions are fine to learn from a screen. Judgment isn't. Judgment needs conversation.
The single all-hands BI training session is the failure mode to avoid outright, not a lesser option to fall back on. DataCamp's research found 35% of enterprise leaders cite time constraints as the single biggest barrier to workforce data upskilling. Cramming everything into one afternoon just moves the failure downstream instead of solving for time. It just moves the failure downstream. Spaced, embedded practice wins because nobody retains four weeks of material from one sitting.
How to choose a BI tool that non-technical new hires can use
None of this roadmap works if the tool at the center of it is one non-technical people quietly avoid. That's already happening at scale: DataStackHub's analysis found 72% of non-technical employees now have BI tool access through data democratization pushes, yet 67% of front-line workers still say they can't get the data they actually need. Access and usability are two completely different problems, and most companies only solve the first one.
Self-serve is growing in the market, but the adoption numbers overstate actual use because rising access doesn't mean rising engagement. Self-serve BI adoption has grown 31% year-over-year, driven by business teams tired of waiting on data engineering for every request. But growth in adoption doesn't mean growth in use. Hex's State of Data Teams research puts real usage of self-serve tools around 20%, even where the tool was sold as universal access. Buying the tool was never the hard part. Getting a non-technical employee to open it on a Tuesday without being told to is.
A good tool checklist should be built to close that exact gap:
- Can someone ask a question without writing a query?
- Are metric definitions locked down so two people asking the same question get the same answer?
- Is the permissions model precise enough that broad access doesn't mean risky access?
- How much setup does the data team need to do before non-technical staff can actually use it?
- Does the tool push insights out to people, or does it just wait for people to come looking?
Definitions and permissions affect whether self-serve access produces real fluency or just noise, and this is where most companies get it backwards: they treat governance as the boring, bureaucratic part and usability as the real product. Most self-serve failures trace back to governance gaps, not accessibility gaps. A tool that lets anyone ask anything, without enforced definitions, doesn't produce fluency. It produces twenty different answers to the same question and a Slack thread arguing about whose number is right.
The global self-service BI market has been valued at several billion dollars in 2025 and is projected to grow substantially through the next decade. The field is growing fast, and the tools inside it genuinely differ in what they demand from a non-technical user, which is what the next section covers.
Which BI tools fit non-technical teams: a practical comparison
Microsoft Power BI
The strongest default for any company already living inside Excel, Teams, SharePoint, and Azure, and a weak choice for anyone outside that ecosystem. Non-technical users get drag-and-drop dashboard building, and Copilot AI (as of the 2026 version) lets people ask data questions in plain language and get a chart back automatically.
Power BI Pro runs $14 per user per month, Premium Per User is $24 per user per month, and Capacity pricing starts at $4,995 per month. Copilot requires paid Microsoft Fabric capacity (F2 or higher). Microsoft lowered that gate from F64+ to F2+ during 2025, but it's still a separate line item.
Onboarding fit is strong because familiarity does most of the work. If staff already live in Excel and Teams, the learning curve is shorter than it looks on paper.
Tableau
The right pick when a dedicated analyst or BI team builds the dashboards and non-technical staff just need to read them well. Consuming a Tableau dashboard is easy. Building one is not, and that job generally still falls to analysts, no matter how the tool gets marketed.
Tableau Pulse, launched in 2024, closes part of that gap by delivering AI-generated metric digests straight to Slack and email, so non-technical users get insight without logging into a dashboard. Pricing for the Creator tier runs $75 per user per month.
This fits when non-technical staff are mainly consumers, not question-askers. It's the wrong choice if the actual goal is self-serve exploration: Pulse solves the "never logs in" problem, not the "wants to ask a new question" problem.
ThoughtSpot
Built for non-technical users who need to query data independently in plain everyday language, especially on top of cloud data warehouses. Type a question, get a chart back. The Spotter AI agent handles follow-up questions and surfaces related insights, no SQL involved.
Pricing starts at $50 per user per month on the Pro plan, billed annually, and Spotter AI is capped at 25 queries per user per month on that tier. The real caveat is setup: The semantic modeling work needed before a broad rollout is real and can take weeks to complete properly. Skipping that step causes the plain-English search to return confusing or wrong answers, which defeats the entire premise of the tool.
This is one of the more independence-friendly options for non-technical users, but only after the setup is done. Budget that time honestly instead of assuming day-one readiness.
Looker
Built for organizations that need governed, consistent analytics across many departments, not for teams chasing intuitive point-and-click exploration. The model-based approach means data teams define metrics once, centrally, so everyone downstream gets the same answer to the same question. No more arguing about whose spreadsheet is right.
The non-technical experience is more technical than most other options here on purpose. Consistency is the product, not ease of first use. Gemini-powered Conversational Analytics reached general availability in November 2025, extending natural-language querying on top of that governed model.
Pricing is at the enterprise end: Vendr's sample of 355 deals put the average annual cost around $150,000, before implementation. That price, combined with the setup lift, makes Looker mostly a fit for larger or fast-growing organizations with a dedicated data team already running the show.
Metabase
The low-barrier option, and the right call for a small team that needs working dashboards fast without a heavy setup process. Free to self-host, with Cloud pricing starting at $85 a month.
The tradeoff is depth: governance and permissions are noticeably thinner than the enterprise tools above. Reasonable for a small team with simple access needs. Riskier for a larger org juggling complex permissions across departments.
Database-native BI, the alternative path for engineering-led teams
For companies whose actual source of truth is a production database (Postgres, MySQL, and similar), skip the separate BI platform entirely and connect a BI or database GUI tool directly to that database. That route gives non-technical staff editable data views, saved queries, and dashboards, without needing a full data warehouse or a full BI implementation first.
Engineering teams manage access. Non-technical staff across product, sales, marketing, ops, and support self-serve answers, and can even edit records safely within row-level permissions. The onboarding advantage is direct: because the tool plugs into data the company already has, instead of requiring a modeling layer to get built first, new hires work with real, current data from day one, instead of waiting on a warehouse or semantic layer that hasn't been stood up yet.
Whichever path a company takes, the tool was never the bottleneck. Onboarding decides whether anyone ever gets far enough to use it.